. 2018 Sep 1;315(3):C319-C329.
doi: 10.1152/ajpcell.00103.2018. Epub 2018 May 16.

MFehi adipose tissue macrophages compensate for tissue iron perturbations in mice

Affiliations

MFehi adipose tissue macrophages compensate for tissue iron perturbations in mice

Merla J Hubler et al. Am J Physiol Cell Physiol. .

Abstract

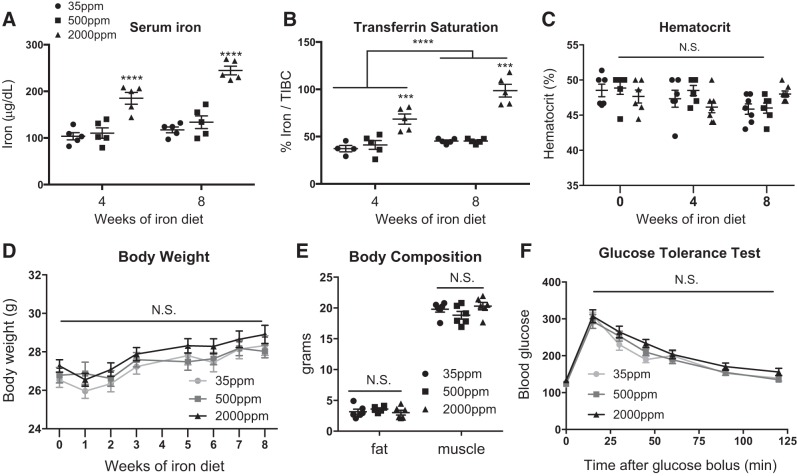
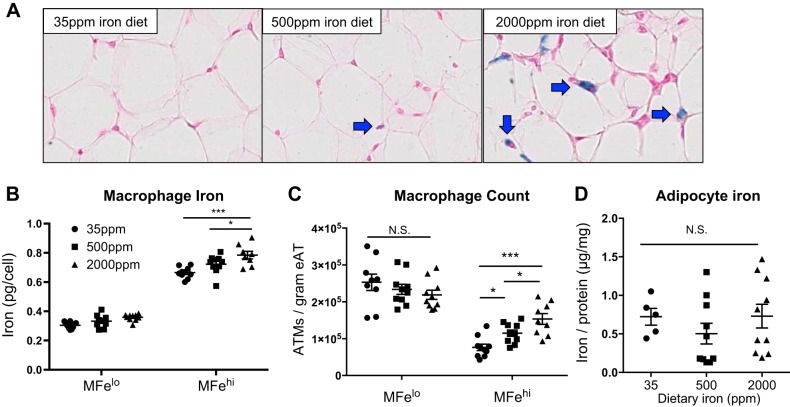
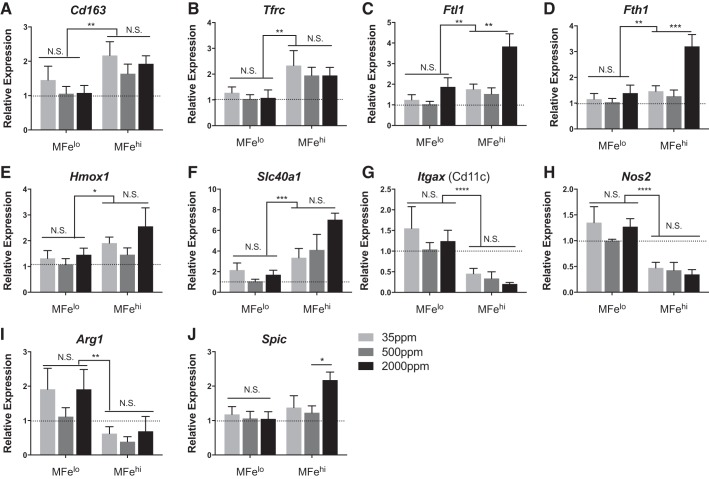
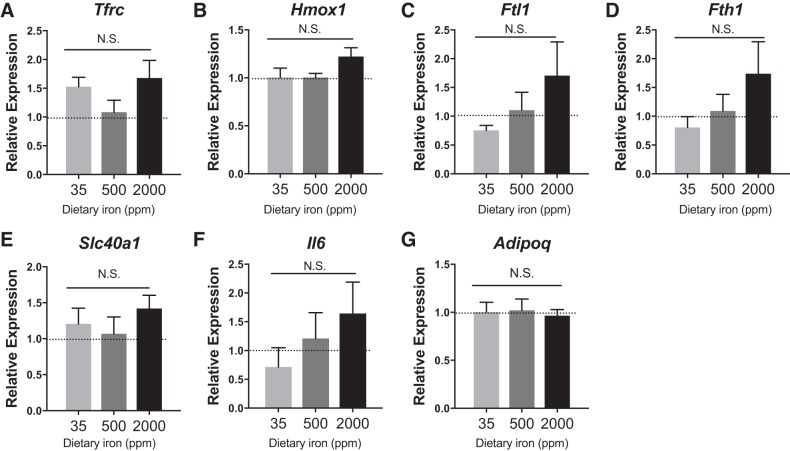
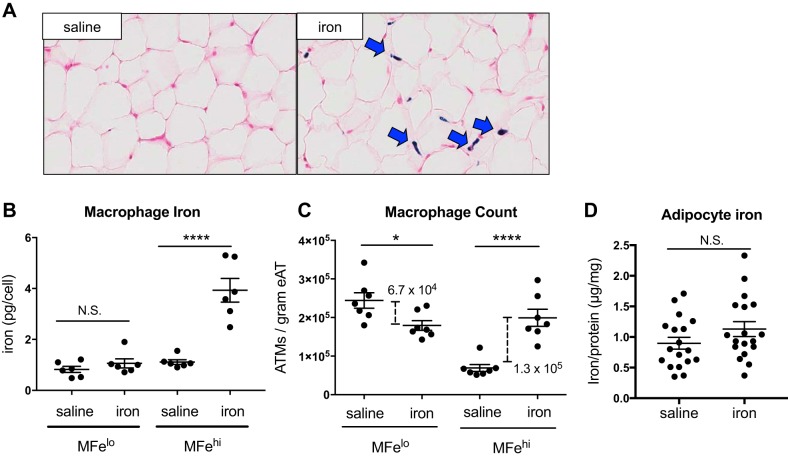
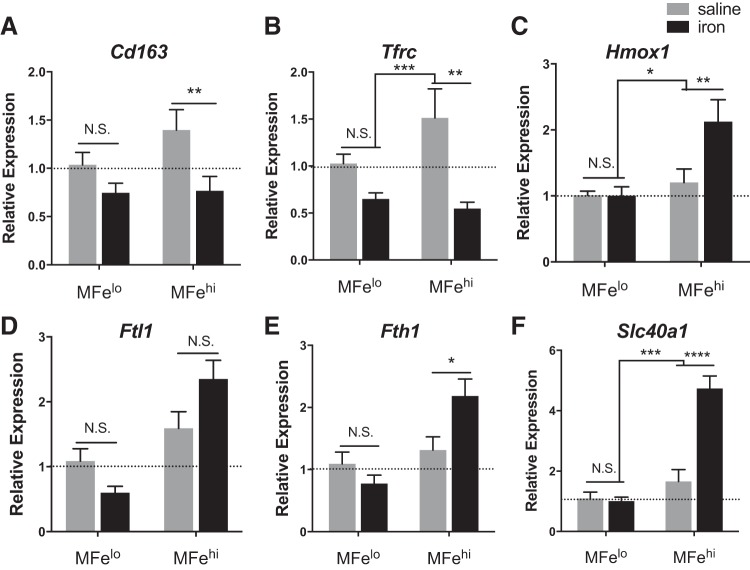
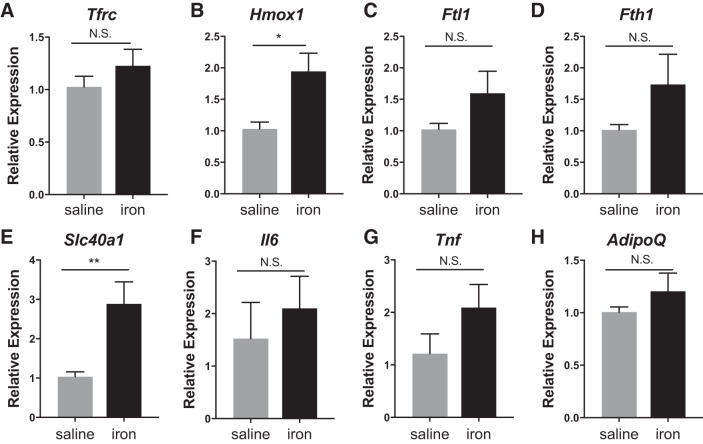
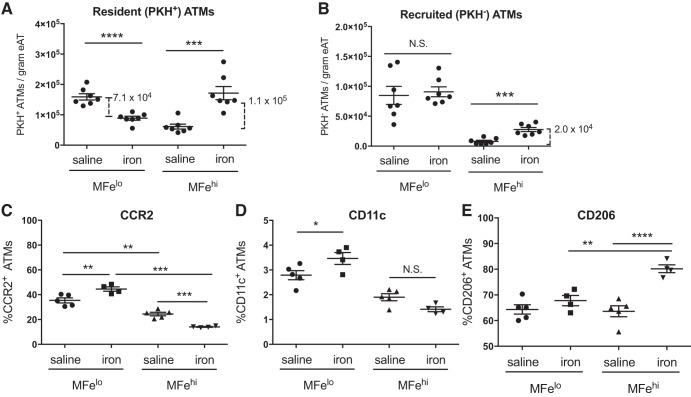
Resident adipose tissue macrophages (ATMs) play multiple roles to maintain tissue homeostasis, such as removing excess free fatty acids and regulation of the extracellular matrix. The phagocytic nature and oxidative resiliency of macrophages not only allows them to function as innate immune cells but also to respond to specific tissue needs, such as iron homeostasis. MFehi ATMs are a subtype of resident ATMs that we recently identified to have twice the intracellular iron content as other ATMs and elevated expression of iron-handling genes. Although studies have demonstrated that iron homeostasis is important for adipocyte health, little is known about how MFehi ATMs may respond to and influence adipose tissue iron availability. Two methodologies were used to address this question: dietary iron supplementation and intraperitoneal iron injection. Upon exposure to high dietary iron, MFehi ATMs accumulated excess iron, whereas the iron content of MFelo ATMs and adipocytes remained unchanged. In this model of chronic iron excess, MFehi ATMs exhibited increased expression of genes involved in iron storage. In the injection model, MFehi ATMs incorporated high levels of iron, and adipocytes were spared iron overload. This acute model of iron overload was associated with increased numbers of MFehi ATMs; 17% could be attributed to monocyte recruitment and 83% to MFelo ATM incorporation into the MFehi pool. The MFehi ATM population maintained its low inflammatory profile and iron-cycling expression profile. These studies expand the field's understanding of ATMs and confirm that they can respond as a tissue iron sink in models of iron overload.

Keywords: adipose; homeostasis; iron; macrophage; polarization.


Figures

Fig. 1.
Fig. 1.
Physiological and serum iron parameters from mice fed diets with varying levels of iron. C57BL/6J mice were given 8 wk of low (35 ppm), average (500 ppm), and high (2,000 ppm) iron diets. AC: serum iron parameters such as serum iron (A) (n = 5), transferrin saturation calculated as % iron/total iron-binding capacity (B) (TIBC; n = 4–6), and hematocrit (C) (n = 6) were quantified. D: body weight was recorded over the study course (n = 18–22). E and F: body composition (E) (n = 6) and glucose tolerance (F) tests were performed after 8 wk on diet (n = 6). For all studies, significant differences were identified using ANOVA and t-test, with the following P-value indicators: ***P < 0.001, ****P < 0.0001. NS, not significant.
Fig. 2.
Fig. 2.
Effect of 8 wk of iron diet feeding on adipose tissue macrophage (ATM; MFehi and MFelo) and adipocyte iron content. C57BL/6J mice were on 8 wk of low (35 ppm), average (500 ppm), and high (2,000 ppm) iron diet. A: whole adipose tissue (AT) was fixed and sectioned, then stained with Prussian blue to visualize iron and counterstained with nuclear fast red. B–D: cells were sorted to quantify iron content per ATM (B) (n = 8–10), ATMs per gram of tissue (C), and adipocyte iron content (D) (n = 8–10). For all studies, significant differences were identified using ANOVA and t-test, with the following P-value indicators: *P < 0.05, ***P < 0.001. eAT, epididymal adipose tissue. NS, not significant.
Fig. 3.
Fig. 3.
Effect of 8 wk of iron diet feeding on adipose tissue macrophage (ATM; MFehi and MFelo) gene expression. C57BL/6 mice were on 8 wk of low (35 ppm), average (500 ppm), and high (2,000 ppm) iron diet. AJ: iron-handling genes were quantified by RT-PCR for MFelo and MFehi ATMs (n = 4–5). Results were normalized to MFelo expression in the average (500 ppm) iron diet. For all studies, significant differences were identified using ANOVA and t-test, with the following P-value indicators: *P < 0.05, **P < 0.01, ***P < 0.001, ****P < 0.0001. NS, not significant.
Fig. 4.
Fig. 4.
Adipocyte gene expression after 8 wk on iron diets. C57BL/6J mice were on 8 wk of low (35 ppm), average (500 ppm), and high (2,000 ppm) iron diet. AG: iron-handling genes were quantified by RT-PCR (n = 4–5). For all studies, significant differences were identified using ANOVA and t-test. NS, not significant.
Fig. 5.
Fig. 5.
Effect of iron injection on adipose tissue macrophage (ATM; MFehi and MFelo) and adipocyte iron content. C57BL/6J mice were given an IP injection of 5 mg/kg iron-dextran 1 wk prior to euthanization. A: whole adipose tissue (AT) was fixed and sectioned, then stained with Prussian blue to visualize iron and counterstained with nuclear red. BD: cells were sorted to quantify iron content per ATM (B) (n = 6), ATMs per gram of tissue (C) (n = 7), and adipocyte iron content (D) (n = 18). For all studies, significant differences were identified using ANOVA and t-test, with the following P-value indicators: *P < 0.05, ****P < 0.0001. NS, not significant.
Fig. 6.
Fig. 6.
Effect of iron injection on adipose tissue macrophage (ATM; MFehi and MFelo) gene expression. C57BL/6J mice were given an IP injection of 5 mg/kg iron-dextran 1 wk before they were euthanized. AF: iron-handling genes were quantified by RT-PCR for MFelo and MFehi ATMs (n = 6). For all studies, significant differences were identified using ANOVA and t-test, with the following P-value indicators: *P < 0.05, **P < 0.01, ***P < 0.001, ****P < 0.0001. NS, not significant.
Fig. 7.
Fig. 7.
Effect of iron injection on adipocyte gene expression. C57BL/6J mice were given an IP injection of 5 mg/kg iron 1 wk before they were euthanized. AH: adipocytes were isolated, RNA prepared, and iron-handling genes quantified by RT-PCR (n = 6). For all studies, significant differences were identified using ANOVA and t-test, with the following P-value indicators: *P < 0.05, **P < 0.01. NS, not significant.
Fig. 8.
Fig. 8.
Effect of iron injection on adipose MFehi and MFelo inflammatory markers and recruitment. Adipose tissue macrophages (ATMs) were marked with PKH26 before iron injection to assess for population shifts as quantified by the resident PKH+ ATMs (A) and monocyte recruitment as quantified by PKH ATMs (B) (n = 7). MFehi and MFelo polarization response to iron injection was quantified by cell-surface inflammatory markers, including M1-associated CCR2 (C) and CD11c (D), as well as M2-associated CD206 (E) (n = 4–6). For all studies, significant differences were identified using ANOVA and t-test, with the following P-value indicators: *P < 0.05, **P < 0.01, ***P < 0.001, ****P < 0.0001. eAT, epididymal adipose tissue. NS, not significant.

References

    1. Bories G, Colin S, Vanhoutte J, Derudas B, Copin C, Fanchon M, Daoudi M, Belloy L, Haulon S, Zawadzki C, Jude B, Staels B, Chinetti-Gbaguidi G. Liver X receptor activation stimulates iron export in human alternative macrophages. Circ Res 113: 1196–1205, 2013. doi: 10.1161/CIRCRESAHA.113.301656. - DOI - PMC - PubMed
    1. Boyle JJ, Johns M, Kampfer T, Nguyen AT, Game L, Schaer DJ, Mason JC, Haskard DO. Activating transcription factor 1 directs Mhem atheroprotective macrophages through coordinated iron handling and foam cell protection. Circ Res 110: 20–33, 2012. doi: 10.1161/CIRCRESAHA.111.247577. - DOI - PubMed
    1. Britton L, Jaskowski LA, Bridle K, Secondes E, Wallace D, Santrampurwala N, Reiling J, Miller G, Mangiafico S, Andrikopoulos S, Subramaniam VN, Crawford D. Ferroportin expression in adipocytes does not contribute to iron homeostasis or metabolic responses to a high calorie diet. Cell Mol Gastroenterol Hepatol 5: 319–331, 2018. doi: 10.1016/j.jcmgh.2018.01.005. - DOI - PMC - PubMed
    1. Cairo G, Recalcati S, Mantovani A, Locati M. Iron trafficking and metabolism in macrophages: contribution to the polarized phenotype. Trends Immunol 32: 241–247, 2011. doi: 10.1016/j.it.2011.03.007. - DOI - PubMed
    1. Coffey R, Ganz T. Iron homeostasis: an anthropocentric perspective. J Biol Chem 292: 12727–12734, 2017. doi: 10.1074/jbc.R117.781823. - DOI - PMC - PubMed

Publication types

LinkOut - more resources