. 2019 Sep 5;105(3):477-492.
doi: 10.1016/j.ajhg.2019.07.006. Epub 2019 Aug 8.

Identifying Putative Susceptibility Genes and Evaluating Their Associations with Somatic Mutations in Human Cancers

Affiliations

Identifying Putative Susceptibility Genes and Evaluating Their Associations with Somatic Mutations in Human Cancers

Zhishan Chen et al. Am J Hum Genet. .

Abstract

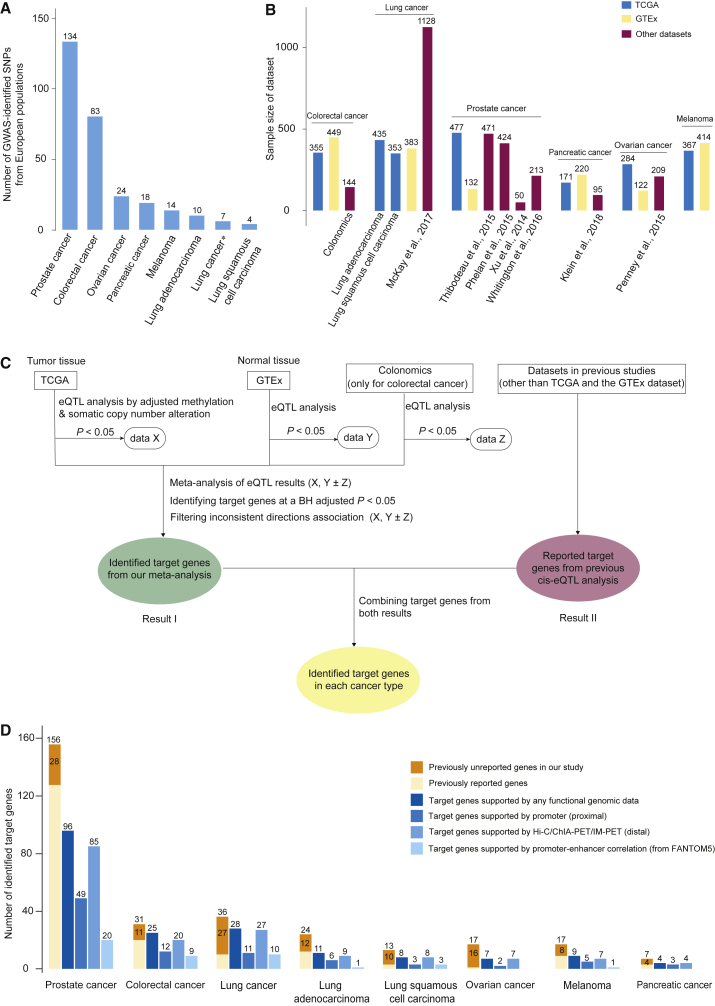
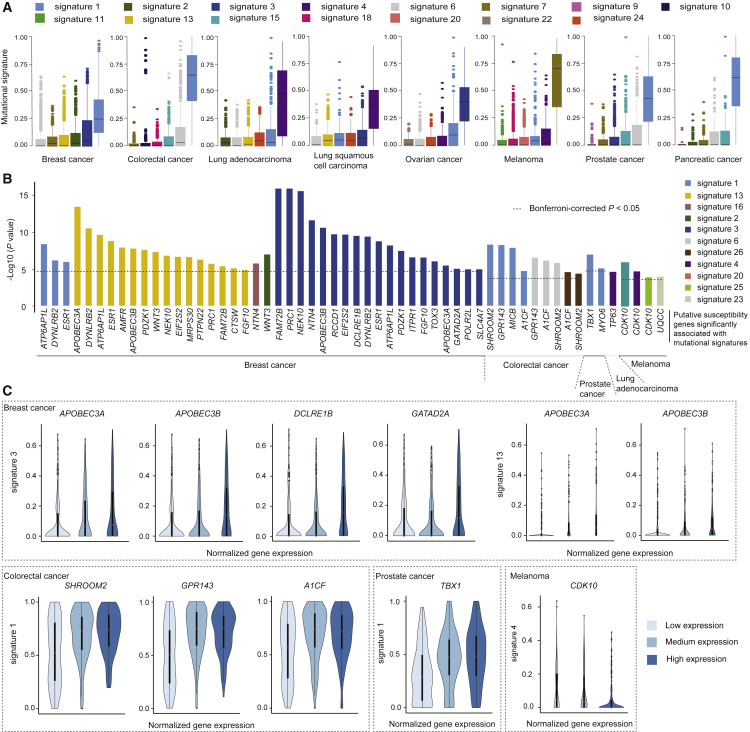
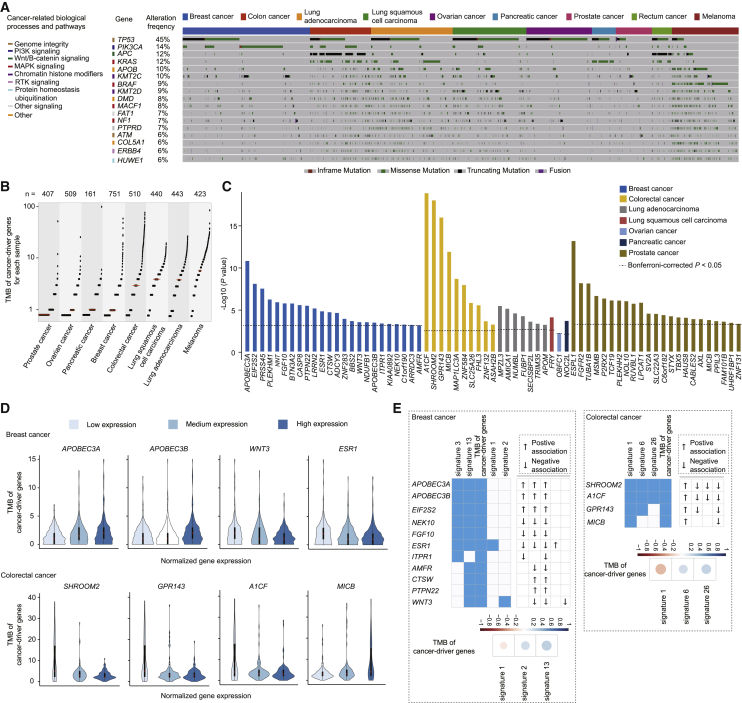
Genome-wide association studies (GWASs) have identified hundreds of genetic risk variants for human cancers. However, target genes for the majority of risk loci remain largely unexplored. It is also unclear whether GWAS risk-loci-associated genes contribute to mutational signatures and tumor mutational burden (TMB) in cancer tissues. We systematically conducted cis-expression quantitative trait loci (cis-eQTL) analyses for 294 GWAS-identified variants for six major types of cancer-colorectal, lung, ovary, prostate, pancreas, and melanoma-by using transcriptome data from the Genotype-Tissue Expression (GTEx) Project, the Cancer Genome Atlas (TCGA), and other public data sources. By using integrative analysis strategies, we identified 270 candidate target genes, including 99 with previously unreported associations, for six cancer types. By analyzing functional genomic data, our results indicate that 180 genes (66.7% of 270) had evidence of cis-regulation by putative functional variants via proximal promoter or distal enhancer-promoter interactions. Together with our previously reported associations for breast cancer risk, our results show that 24 genes are shared by at least two cancer types, including four genes for both breast and ovarian cancer. By integrating mutation data from TCGA, we found that expression levels of 33 and 66 putative susceptibility genes were associated with specific mutational signatures and TMB of cancer-driver genes, respectively, at a Bonferroni-corrected p < 0.05. Together, these findings provide further insight into our understanding of how genetic risk variants might contribute to carcinogenesis through the regulation of susceptibility genes that are related to the biogenesis of somatic mutations.

Keywords: GWAS-identified variants; cancer driver genes; cis-eQTL; functional variants; gene expression; human cancers; mutational signature; susceptibility genes; tumor mutational burden.


Conflict of interest statement

The authors declare no competing interests.

Figures

Figure 1
Figure 1
Identification of Candidate Target Genes for GWAS-Identified SNPs in Six Cancer Types (A) A histogram showing the number of characterized GWAS-identified SNPs in this study across six cancer types. The refers to SNPs commonly identified for both lung adenocarcinoma and squamous cell carcinoma (this note applies to other legends in this figure). (B) A histogram showing sample size for each dataset across six cancer types. The dataset from TCGA is depicted in blue, the dataset from the GTEx is depicted in yellow, and datasets other than TCGA and the GTEx are depicted in red. (C) A flow chart illustrating the identification of target genes for GWAS-identified SNPs on the basis of cis-eQTL analysis, using data from both TCGA and the GTEx datasets across six cancer types. The rounded rectangle indicates the eQTL target genes identified by TCGA and the GTEx. The green box indicates the target genes that are identified using BH-corrected p < 0.05 from a meta-analysis of eQTL results from TCGA and the GTEx. The data from the Colonomics was also included for colorectal cancer. The red box refers to previously reported target genes. The yellow box refers to target genes after combining results from both our meta-analysis and previous eQTL analysis. (D) A histogram showing the number of target genes identified and those supported by additional evidence from functional genomic data. The previously unreported target genes in our study are highlighted with deep yellow. Previously reported target genes are depicted in light yellow. The shades of blue from left to right refer to target genes supported by evidence of additional functional genomic data including promoter (proximal), chromatin-chromatin interaction data (distal), and promoter-enhancer correlation data (from FANTOM5).
Figure 2
Figure 2
Putative Cancer-Susceptibility Genes Commonly Implicated in Multiple Cancer Types (A) A histogram showing the number of target genes commonly implicated in multiple cancer types. The refers to genes for lung adenocarcinoma and/or lung squamous cell carcinoma (this note applies to all other following figure legends). (B) A heatmap showing target genes commonly observed from different cancer types. The arrow refers to a putative oncogene or putative tumor suppressor gene inferred by associations between expression levels of these genes and risk alleles of index SNPs from GWAS. (C) A total of 23 target genes commonly observed in different cancer types are located in the three regions: 17q21.3, 6p22.1-6p21.33-6p21.32, and 2q33.1. Lines with different colors refer to different cancer types. LD values (based on data from European populations from the 1000 Genomes project) are presented for two index SNPs linked by a dashed curve.
Figure 3
Figure 3
Putative Susceptibility Genes Associated with Specific Somatic Mutational Signatures (A) Top mutational signatures contributing to TMB for each cancer type. Each color refers to a specific mutational signature. (B) Bar plots showing the significance of putative susceptibility genes associated with mutational signatures at nominal p < 0.05 identified for four cancer types. The dashed lines indicate a cutoff of Bonferroni-corrected p < 0.05 for each cancer type. (C) Violin plots of samples separated by low, median, and high expression levels of the highlighted genes (see Results); the genes were associated with specific mutational signatures at Bonferroni-corrected p < 0.05 for four cancer types. The upper dashed box shows the associations between represented genes and signature 3, as well as signature 13 in breast cancer. Lower diagram: in the dashed boxes from the left to the right, the genes SHROOM2, GPR143, and AICF in colorectal cancer, TBX1 in prostate cancer, and CDK10 in melanoma are presented.
Figure 4
Figure 4
Putative Susceptibility Genes Associated with TMB of Cancer-Driver Genes (A) Mutation spectrum of cancer-driver genes with high alteration frequency (≥6%) in each sample across cancer types. The top boxes with different colors indicate samples of different cancer types. The lines in different colors indicate the mutation of each driver gene in each sample. The carcinogenesis signaling pathways for these driver genes are indicated with different colors on the left. (B) Scatterplots for TMB of cancer-driver genes for each sample across seven cancer types. Each dot represents each sample and “n” refers to sample size. The red line indicates the median of TMB of cancer-driver genes for each cancer type. (C) Bar plots showing the statistical significance between expression levels of putative susceptibility genes and TMB of cancer-driver genes across seven cancer types. The dashed lines indicate the genes with statistical associations at Bonferroni-corrected p < 0.05 in each cancer type. (D) Violin plots of samples separated by low, median, and high expression levels of the highlighted genes (see Results); the genes were associated with TMB of cancer-driver genes at Bonferroni-correction p < 0.05. The upper plots show the associations in breast cancer, the lower plots show the associations in colorectal cancer. (E) Heatmap plots showing the putative susceptibility genes associated with both TMB of cancer-driver genes and mutational signatures in breast and colorectal cancer. The ↑ and ↓ refer to a positive and negative association, respectively. The lower plots show the correlation coefficients between TMB of cancer-driver genes and mutational signatures in breast and colorectal cancer, respectively.

References

    1. MacArthur J., Bowler E., Cerezo M., Gil L., Hall P., Hastings E., Junkins H., McMahon A., Milano A., Morales J. The new NHGRI-EBI Catalog of published genome-wide association studies (GWAS Catalog) Nucleic Acids Res. 2017;45(D1):D896–D901. - PMC - PubMed
    1. Michailidou K., Lindström S., Dennis J., Beesley J., Hui S., Kar S., Lemaçon A., Soucy P., Glubb D., Rostamianfar A., NBCS Collaborators; ABCTB Investigators; ConFab/AOCS Investigators Association analysis identifies 65 new breast cancer risk loci. Nature. 2017;551:92–94. - PMC - PubMed
    1. Benafif S., Kote-Jarai, and Z., Eeles R.A., PRACTICAL Consortium A review of prostate cancer genome-wide association studies (GWAS) Cancer Epidemiol. Biomarkers Prev. 2018;27:845–857. - PMC - PubMed
    1. Bossé Y., Amos C.I. A Decade of GWAS results in lung cancer. Cancer Epidemiol. Biomarkers Prev. 2018;27:363–379. - PMC - PubMed
    1. Huyghe J.R., Bien S.A., Harrison T.A., Kang H.M., Chen S., Schmit S.L., Conti D.V., Qu C., Jeon J., Edlund C.K. Discovery of common and rare genetic risk variants for colorectal cancer. Nat. Genet. 2019;51:76–87. - PMC - PubMed

Publication types