. 2021 Jan;231(1):e13547.
doi: 10.1111/apha.13547. Epub 2020 Sep 22.

Inactivation of HIF-prolyl 4-hydroxylases 1, 2 and 3 in NG2-expressing cells induces HIF2-mediated neurovascular expansion independent of erythropoietin

Affiliations

Inactivation of HIF-prolyl 4-hydroxylases 1, 2 and 3 in NG2-expressing cells induces HIF2-mediated neurovascular expansion independent of erythropoietin

Andrés A Urrutia et al. Acta Physiol (Oxf). 2021 Jan.

Abstract

Aim: NG2 cells in the brain are comprised of pericytes and NG2 glia and play an important role in the execution of cerebral hypoxia responses, including the induction of erythropoietin (EPO) in pericytes. Oxygen-dependent angiogenic responses are regulated by hypoxia-inducible factor (HIF), the activity of which is controlled by prolyl 4-hydroxylase domain (PHD) dioxygenases and the von Hippel-Lindau (VHL) tumour suppressor. However, the role of NG2 cells in HIF-regulated cerebral vascular homeostasis is incompletely understood.

Methods: To examine the HIF/PHD/VHL axis in neurovascular homeostasis, we used a Cre-loxP-based genetic approach in mice and targeted Vhl, Epo, Phd1, Phd2, Phd3 and Hif2a in NG2 cells. Cerebral vasculature was assessed by immunofluorescence, RNA in situ hybridization, gene and protein expression analysis, gel zymography and in situ zymography.

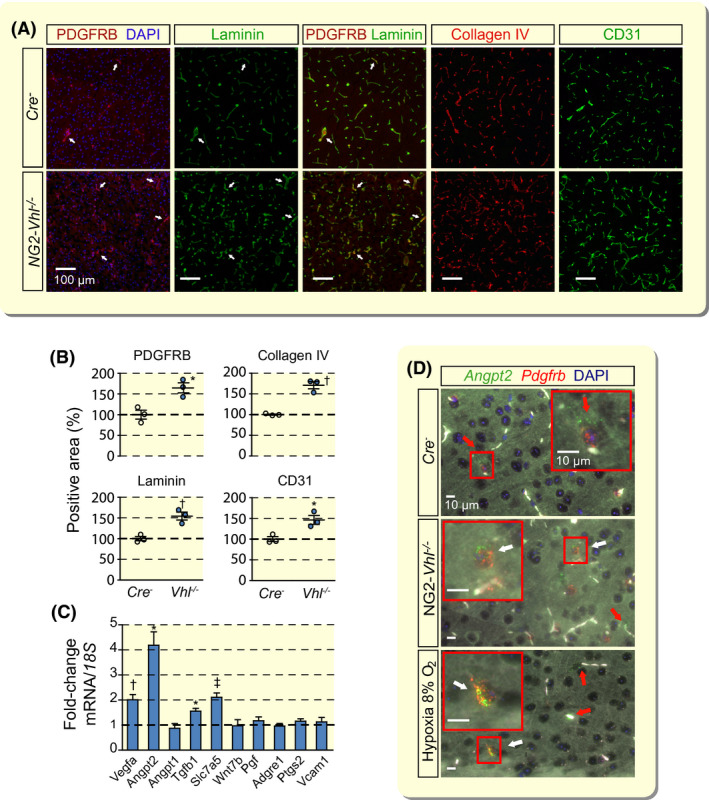
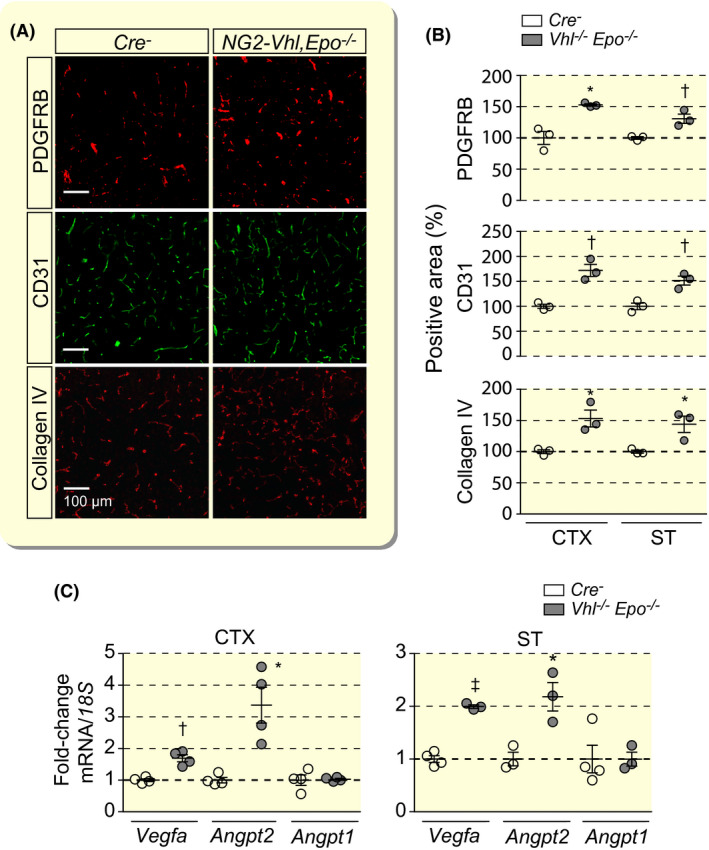
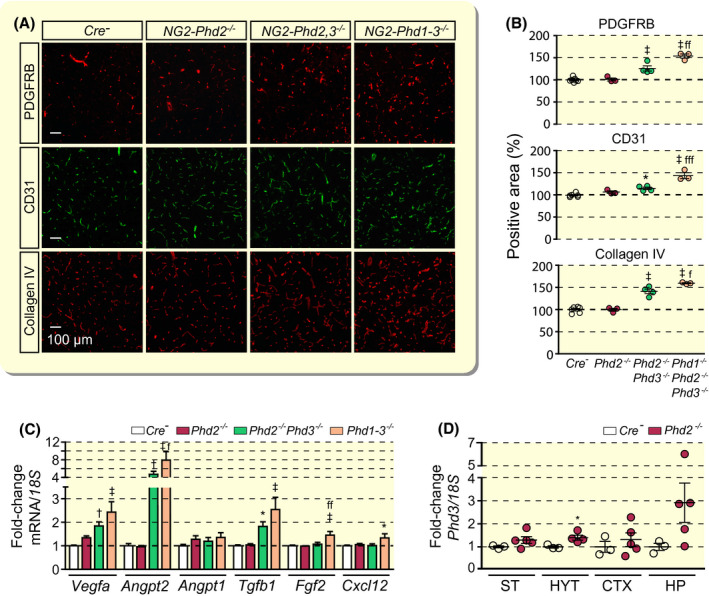
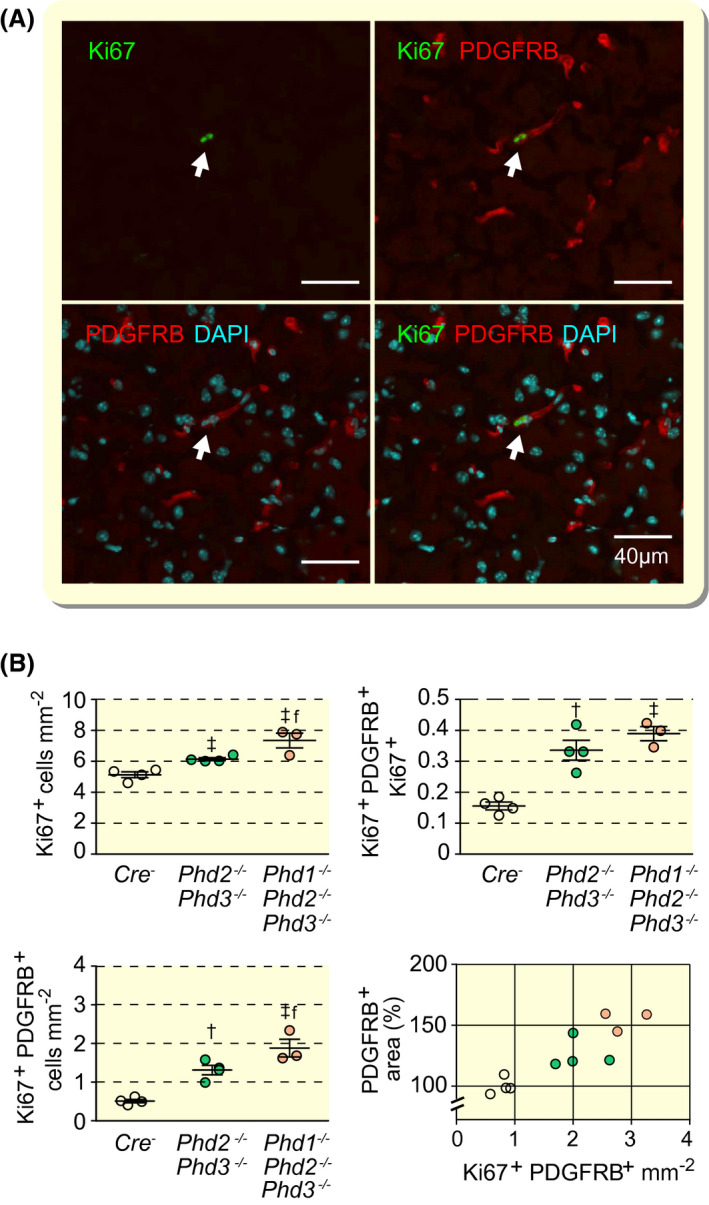
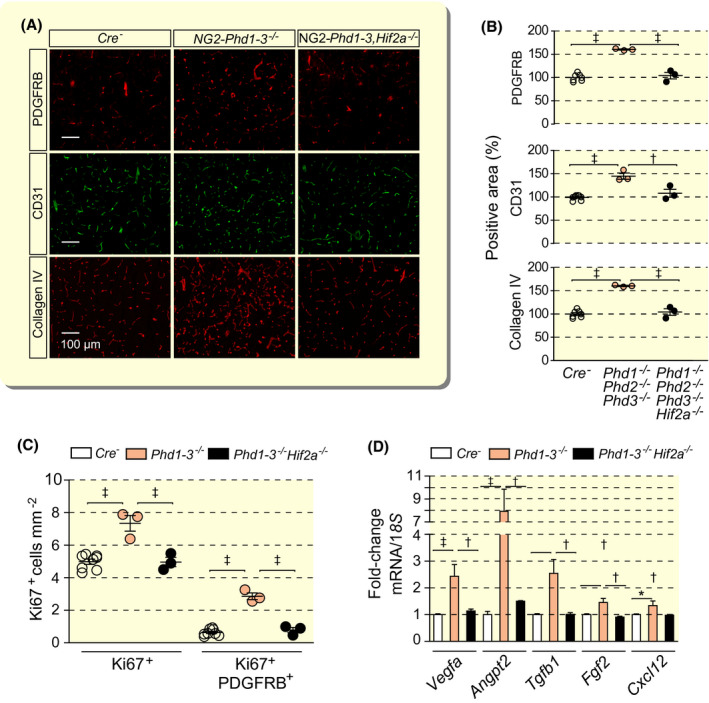
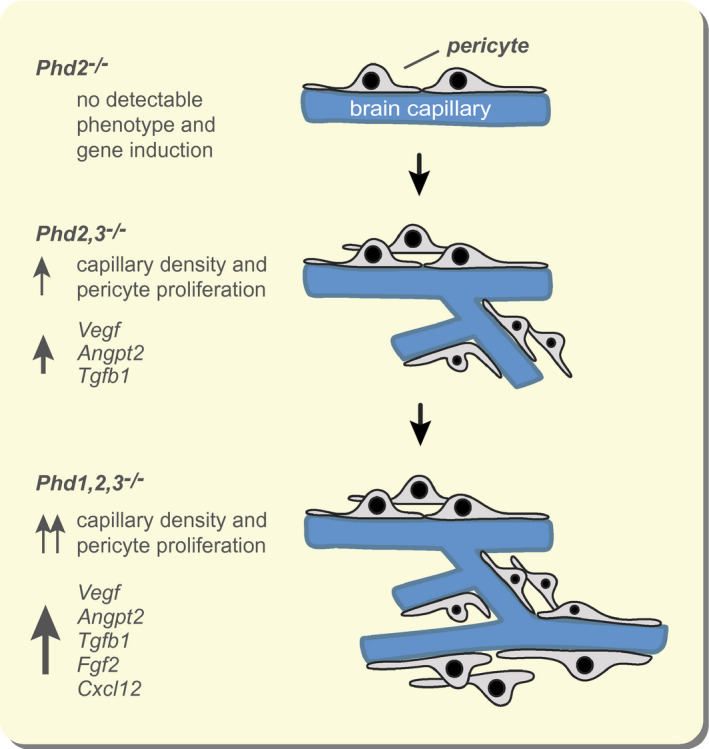
Results: Vhl inactivation led to a significant increase in angiogenic gene and Epo expression. This was associated with EPO-independent expansion of capillary networks in cortex, striatum and hypothalamus, as well as pericyte proliferation. A comparable phenotype resulted from the combined inactivation of Phd2 and Phd3, but not from Phd2 inactivation alone. Concomitant PHD1 function loss led to further expansion of the neurovasculature. Genetic inactivation of Hif2a in Phd1/Phd2/Phd3 triple mutant mice resulted in normal cerebral vasculature.

Conclusion: Our studies establish (a) that HIF2 activation in NG2 cells promotes neurovascular expansion and remodelling independently of EPO, (b) that HIF2 activity in NG2 cells is co-controlled by PHD2 and PHD3 and (c) that PHD1 modulates HIF2 transcriptional responses when PHD2 and PHD3 are inactive.

Keywords: HIF; angiogenesis; brain; erythropoietin; pericytes; prolyl 4-hydroxylase domain.


Conflict of interest statement

The authors declare that no conflict of interest exists.

Figures

FIGURE 1
FIGURE 1
Vhl inactivation in NG2 cells results in neurovascular remodelling and expansion. A, Representative immunofluorescence (IF) images of frozen brain sections from Cre control and NG2‐Vhl−/− mice (age 9‐10 wk) stained for markers of pericytes (PDGFRB), basement membrane (laminin and collagen IV) and endothelial cells (CD31); cortex; scale bar, 100 µm. Nuclei were stained with 4′,6‐diamidino‐2‐phenylindole (DAPI, blue fluorescence). There is complete overlap between PDGRFB and laminin IF staining. White arrows exemplify double‐positive structures. B, Quantification of PDGFRB‐, laminin‐, collagen IV‐ and CD31‐positive area expressed as percentage of Cre control, (n = 3). C, Relative mRNA transcript levels in NG2‐Vhl−/− cortex expressed as fold‐change compared with Cre control, (n = 3‐5). D, Representative images of multiplex RNA FISH of cortical tissue from Cre control, NG2‐Vhl−/− and hypoxic wild‐type mice (normobaric hypoxia, 8% O2 for 24 h) detecting angiopoietin 2 (green fluorescent signal) and Pdgfrb‐expressing cells (red fluorescent signal). White arrows depict cells positive for both Angpt2 and Pdgfrb; red arrows depict cells in the direct vicinity of micro‐vessels that are positive for Angpt2 and negative for Pdgfrb. White structures represent auto‐fluorescent red blood cells. Nuclei were stained with DAPI (blue fluorescent signal); scale bar, 10 µm. Data are represented as mean ± SEM; two‐tailed Student's t test; *P < .05, P < .01 and P < .001 compared with Cre control. Adgre1, adhesion G‐protein‐coupled receptor E1; Angpt1, angiopoietin 1; Angpt2, angiopoietin 2; Pgf, placental growth factor; Ptgs2, prostaglandin‐endoperoxide synthase 2; Slc7a5, solute carrier 7a5; Tgfb1, transforming growth factor beta 1; Vcam1, vascular cell adhesion molecule 1; Vegfa, vascular endothelial growth factor A; Wnt7b, wingless‐type MMTV integration site family, member 7B
FIGURE 2
FIGURE 2
Cerebral vascular expansion in NG2‐Vhl−/− mutant mice is not EPO‐dependent. A, Representative immunofluorescence images of frozen brain sections from Cre control and NG2‐Vhl−/−Epo−/− (Vhl‐/‐Epo−/−) mice stained for markers of pericytes (PDGFRB), endothelial cells (CD31) and basement membrane (collagen IV); shown is cortex; scale bar, 100 µm. B, Quantification of cortical and striatal PDGFRB‐, CD31‐ and collagen IV‐positive areas expressed as percentage of Cre control, (n = 3). C, Relative mRNA levels in cerebral cortex (CTX) and striatum (ST) from NG2‐Vhl−/−Epo−/− mice expressed as fold‐change compared with Cre control, (n = 4). Data are represented as mean ± SEM; two‐tailed Student's t test; *P < .05, P < .01 and P < .001. Angpt1, angiopoietin 1; Angpt2, angiopoietin 2; Vegfa, vascular endothelial growth factor A
FIGURE 3
FIGURE 3
Combined inactivation of Phd2 and Phd3 but not inactivation of Phd2 alone promotes cerebral vascular expansion. A, Representative immunofluorescent images of frozen brain sections from Cre control, NG2‐Phd2−/−, NG2‐Phd2−/−Phd3−/− (NG2‐Phd2,3−/−) and NG2‐Phd1−/−Phd2−/−Phd3−/− (NG2‐Phd1‐3−/−) mice stained for PDGFRB, CD31 and collagen IV; scale bar, 100 µm. B, Quantification of cortical PDGFRB‐, CD31‐ and collagen IV‐positive areas expressed as percentage of Cre control (n = 3‐6). C, Relative cortical mRNA transcript levels in homogenates from cortex of Cre control, NG2‐Phd2−/−, NG2‐Phd2−/−Phd3−/− and NG2‐Phd1−/−Phd2−/−Phd3−/− mice expressed as fold‐change compared to Cre control (n = 4‐11). D, Phd3 transcript levels in striatum (ST), hypothalamus (HYT); cortex (CTX) and hippocampus (HP) from Cre control and NG2‐Phd2−/− mice. Data are represented as mean ± SEM; one‐way ANOVA followed by Tukey's post hoc analysis; *P < .05, P < .01 and P < .001 compared with Cre control; f P < 0.05, ff P < 0.01, and fffP < 0.001 compared with NG2‐Phd2−/−Phd3−/− mice. Angpt1, angiopoietin 1; Angpt2, angiopoietin 2; Cxcl12, C‐X‐C motif chemokine 12; Fgf2, fibroblast growth factor 2; Tgfb1, transforming growth factor beta 1; Vegfa, vascular endothelial growth factor A
FIGURE 4
FIGURE 4
Combined inactivation of Phd2 and Phd3 in NG2 cells promotes pericyte proliferation. A, Representative high‐power immunofluorescence images of proliferating pericytes in cerebral cortex depicted by white arrows. PDGFRB‐positive cells are identified by red fluorescence and proliferating cells by Ki67 staining (green fluorescent signal). Nuclei were stained with 4′,6‐diamidino‐2‐phenylindole (DAPI, blue fluorescence); scale bar, 40 µm. B, Quantification of cells in cerebral cortex from Cre control, NG2‐Phd2−/−Phd3−/− and NG2‐Phd1−/−Phd2−/−Phd3−/− mice; (age 9‐10 wk, n = 3‐4). Left upper panel, Ki67+ cells; left lower panel, proliferating pericytes (Ki67+PDGFRB+); right upper panel, ratio of Ki67+PDGFRB+ cells over total number of Ki67+ cells; right lower panel, correlation between pericyte covered area (PDGFRB+ cells) and proliferating pericytes; Cre control (empty circles); NG2‐Phd2−/−Phd3−/− (green circles); NG2‐Phd1−/−Phd2−/−Phd3−/− mice (coral‐colored circles); Pearson's r = 0.8895, P = .0002 (two‐tailed). Data are represented as mean ± SEM; one‐way ANOVA followed by Tukey's post hoc analysis, P < .01 and P < .001 compared with Cre controls. f P < 0.05 compared with NG2‐Phd2−/−Phd3−/− mice
FIGURE 5
FIGURE 5
Vascular expansion and pericyte proliferation in mice with combined Phd1, Phd2, Phd3 deletion is HIF2‐dependent. A, Representative immunofluorescence images of frozen brain sections from Cre control, NG2‐Phd1−/−Phd2−/−Phd3−/− (Phd1‐3−/−) and NG2‐Phd1−/−Phd2−/−Phd3−/−Hif2a−/− (Phd1‐3,−/−Hif2a−/−) mice stained for markers of pericytes (PDGFRB), endothelial cells (CD31) and basement membrane (collagen IV); scale bar, 100 µm. B, Quantification of cortical PDGFRB‐, CD31‐ and collagen IV‐positive areas expressed as percentage of Cre control, (n = 3‐8). C, Quantification of proliferating cells (Ki67+) and proliferating pericytes (Ki67+ PDGFRB+) in cerebral cortex from Cre control, NG2‐Phd1−/−Phd2−/−Phd3−/− and NG2‐Phd1−/−Phd2−/−Phd3−/−Hif2a−/− mice, (n = 3‐8). D, Relative mRNA levels in cortex homogenates from Cre control, NG2‐Phd1−/−Phd2−/−Phd3−/− and NG2‐Phd1−/−Phd2−/−Phd3−/−Hif2−/− mice, (n = 3‐8). Data are represented as mean ± SEM; one‐way ANOVA followed by Tukey's post hoc analysis, *P < .05, P < .01 and P < .001 compared with Cre controls, ff P < 0.01 and fff P < 0.001 compared with NG2‐Phd1−/−Phd2−/−Phd3−/− mice. Angpt2, angiopoietin 2; Cxcl12, C‐X‐C motif chemokine 12; Fgf2, fibroblast growth factor 2; Tgfb1, transforming growth factor beta 1; Vegfa, vascular endothelial growth factor A
FIGURE 6
FIGURE 6
Differential role of individual HIF‐PHDs in the regulation of neurovascular homeostasis. Overview of findings in mice with Phd gene inactivation in NG2 cells. Angpt2, angiopoietin 2; Cxcl12, C‐X‐C motif chemokine 12; Fgf2, fibroblast growth factor 2; Tgfb1, transforming growth factor beta 1; Vegfa, vascular endothelial growth factor A

Comment in

References

    1. Raichle ME, Gusnard DA. Appraising the brain's energy budget. Proc Natl Acad Sci USA. 2002;99(16):10237‐10239. - PMC - PubMed
    1. Girouard H, Iadecola C. Neurovascular coupling in the normal brain and in hypertension, stroke, and Alzheimer disease. J Appl Physiol. 2006;100(1):328‐335. - PubMed
    1. Mistry N, Mazer CD, Sled JG, et al. Red blood cell antibody‐induced anemia causes differential degrees of tissue hypoxia in kidney and brain. Am J Physiol Regul Integr Comp Physiol. 2018;314(4):R611‐R622. - PMC - PubMed
    1. Kaelin WG, Ratcliffe PJ. Oxygen sensing by metazoans: the central role of the HIF hydroxylase pathway. Mol Cell. 2008;30(4):393‐402. - PubMed
    1. Semenza GL. Hypoxia‐inducible factors in physiology and medicine. Cell. 2012;148(3):399‐408. - PMC - PubMed

Publication types

Substances