Filters applied. Clear filters
. 2021 Nov 1;220(11):e202103080.
doi: 10.1083/jcb.202103080. Epub 2021 Oct 14.

Rac1 promotes kidney collecting duct integrity by limiting actomyosin activity

Affiliations

Rac1 promotes kidney collecting duct integrity by limiting actomyosin activity

Fabian Bock et al. J Cell Biol. .

Abstract

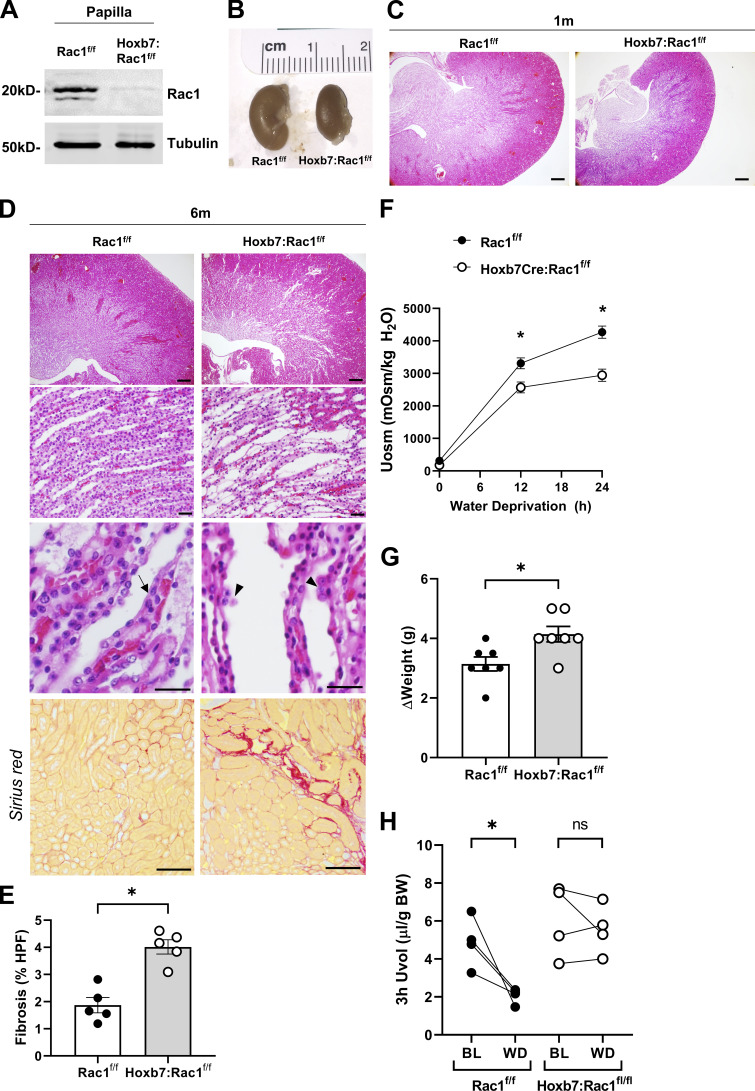
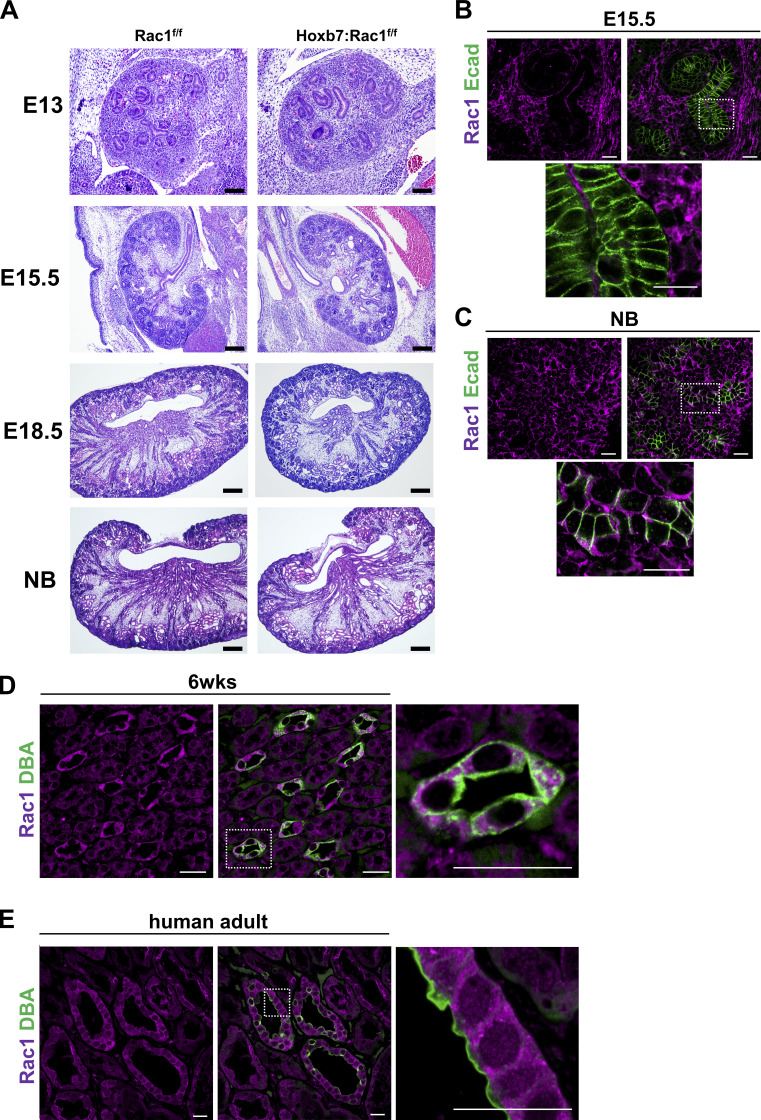
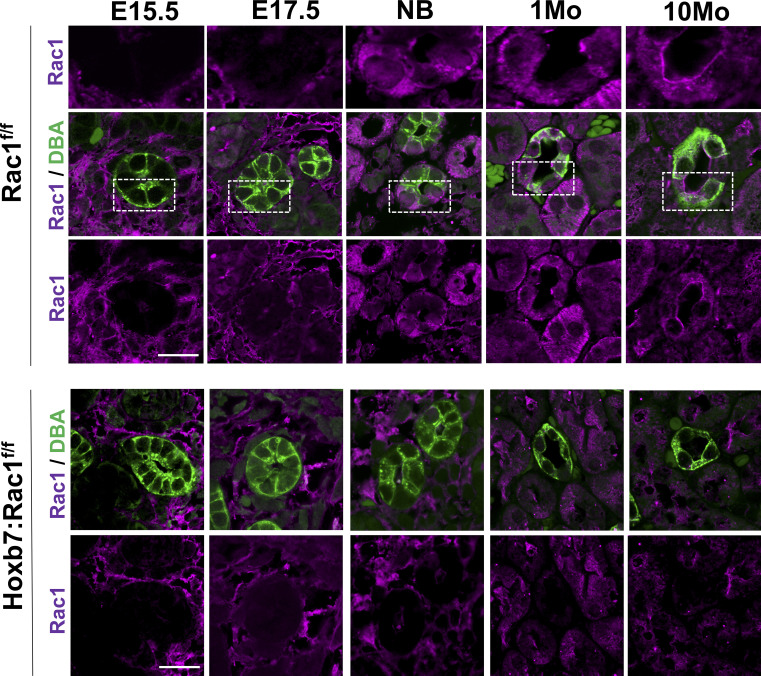
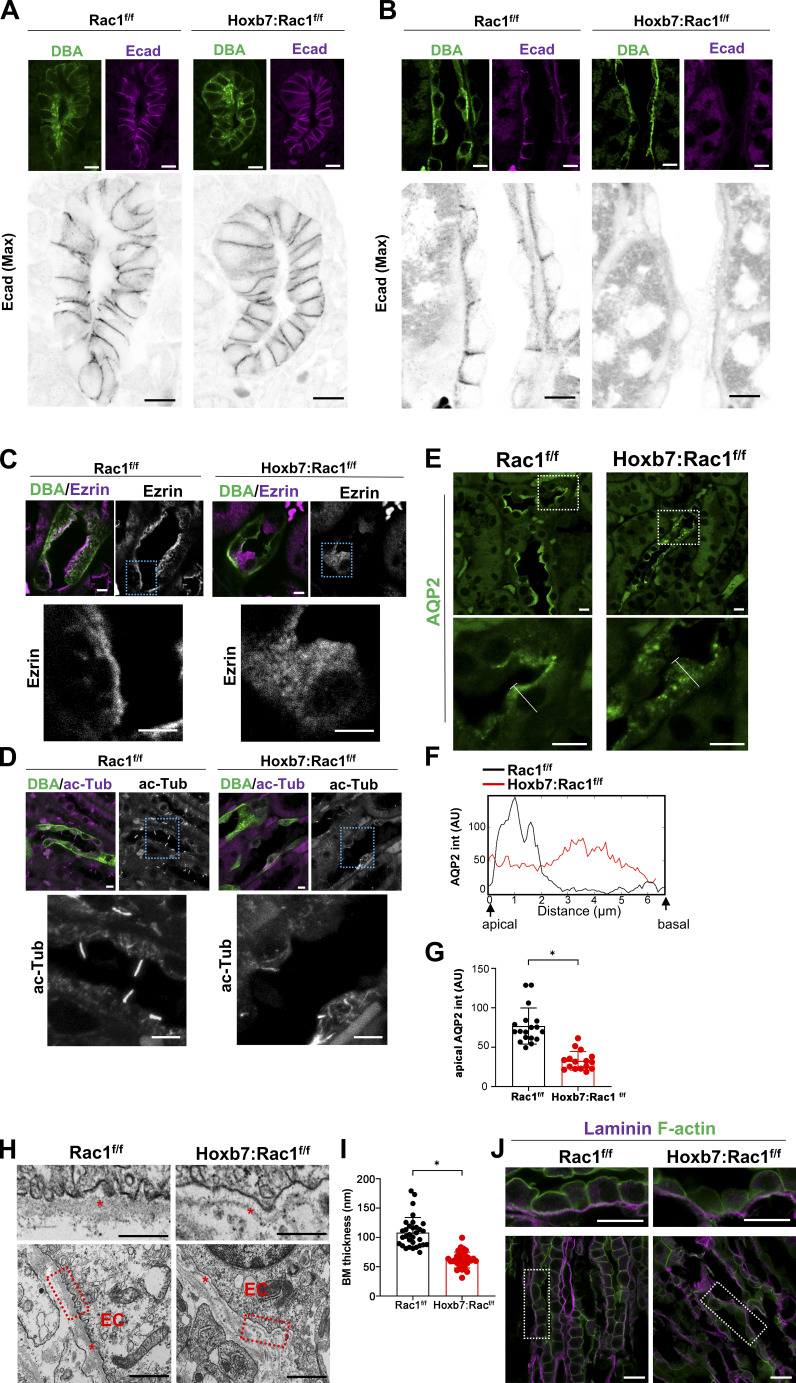
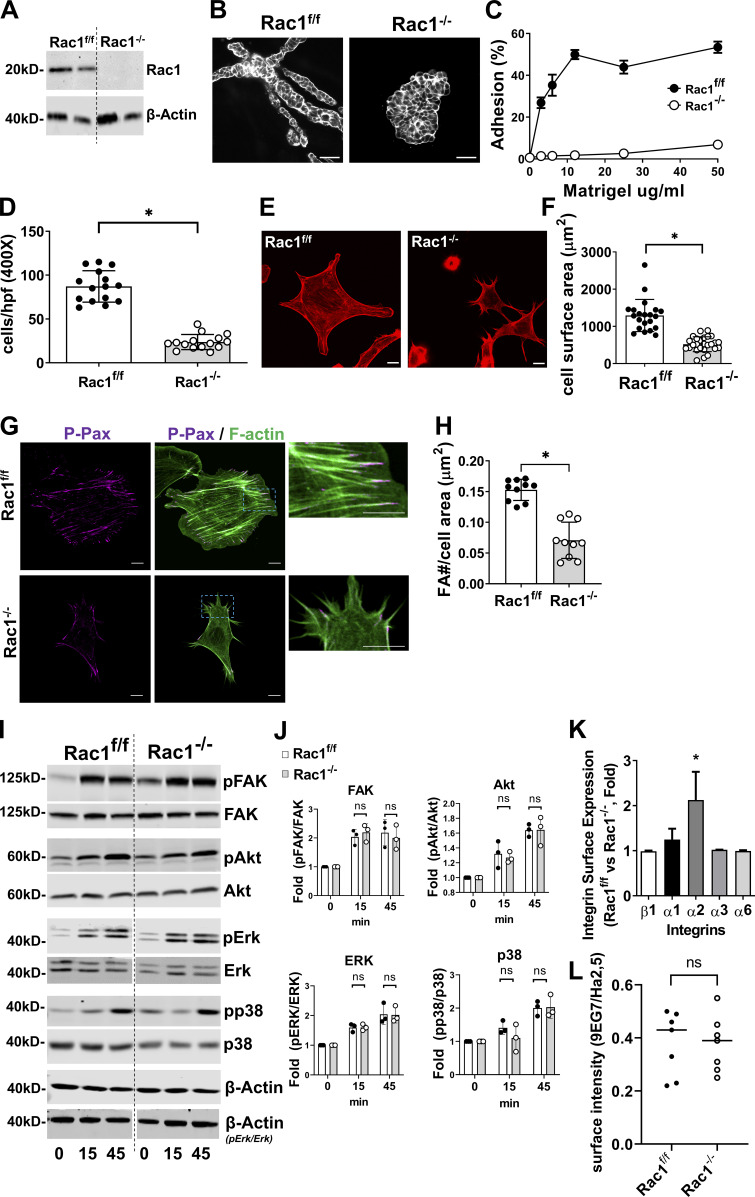
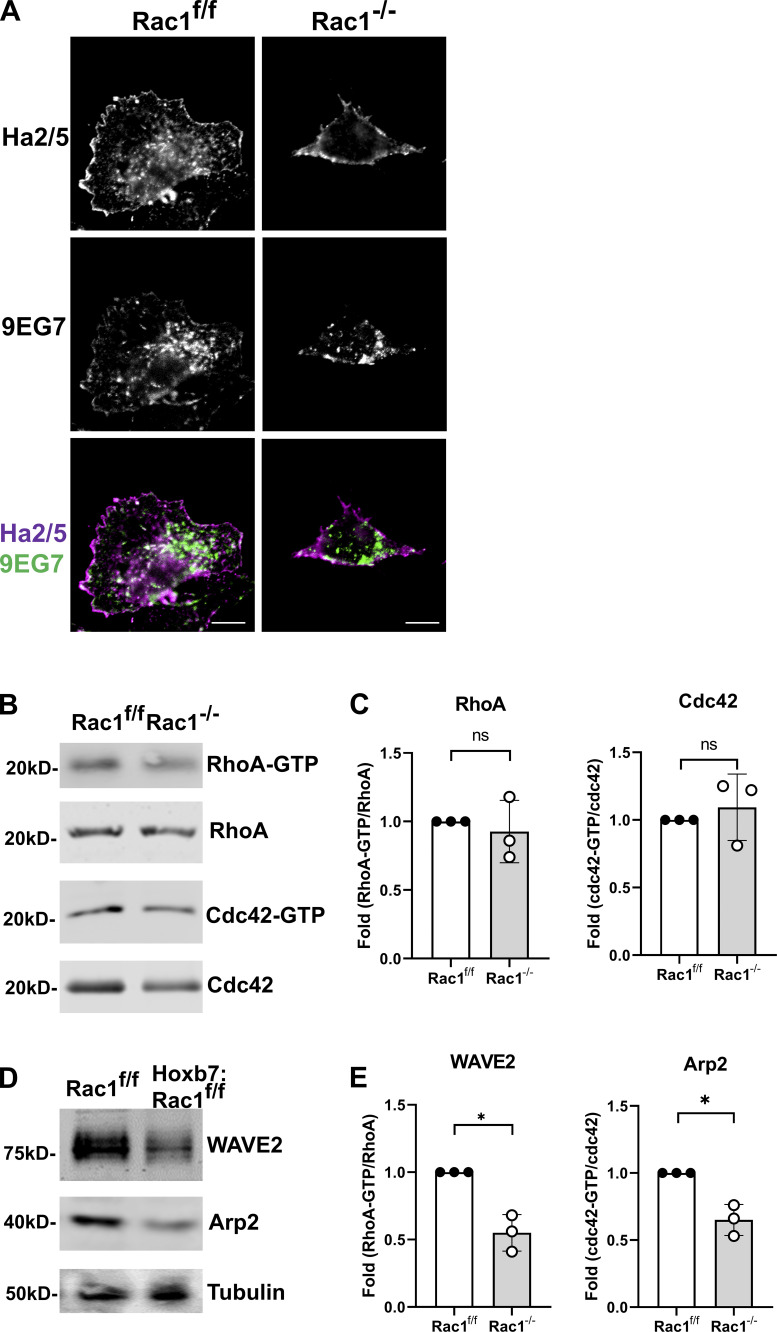
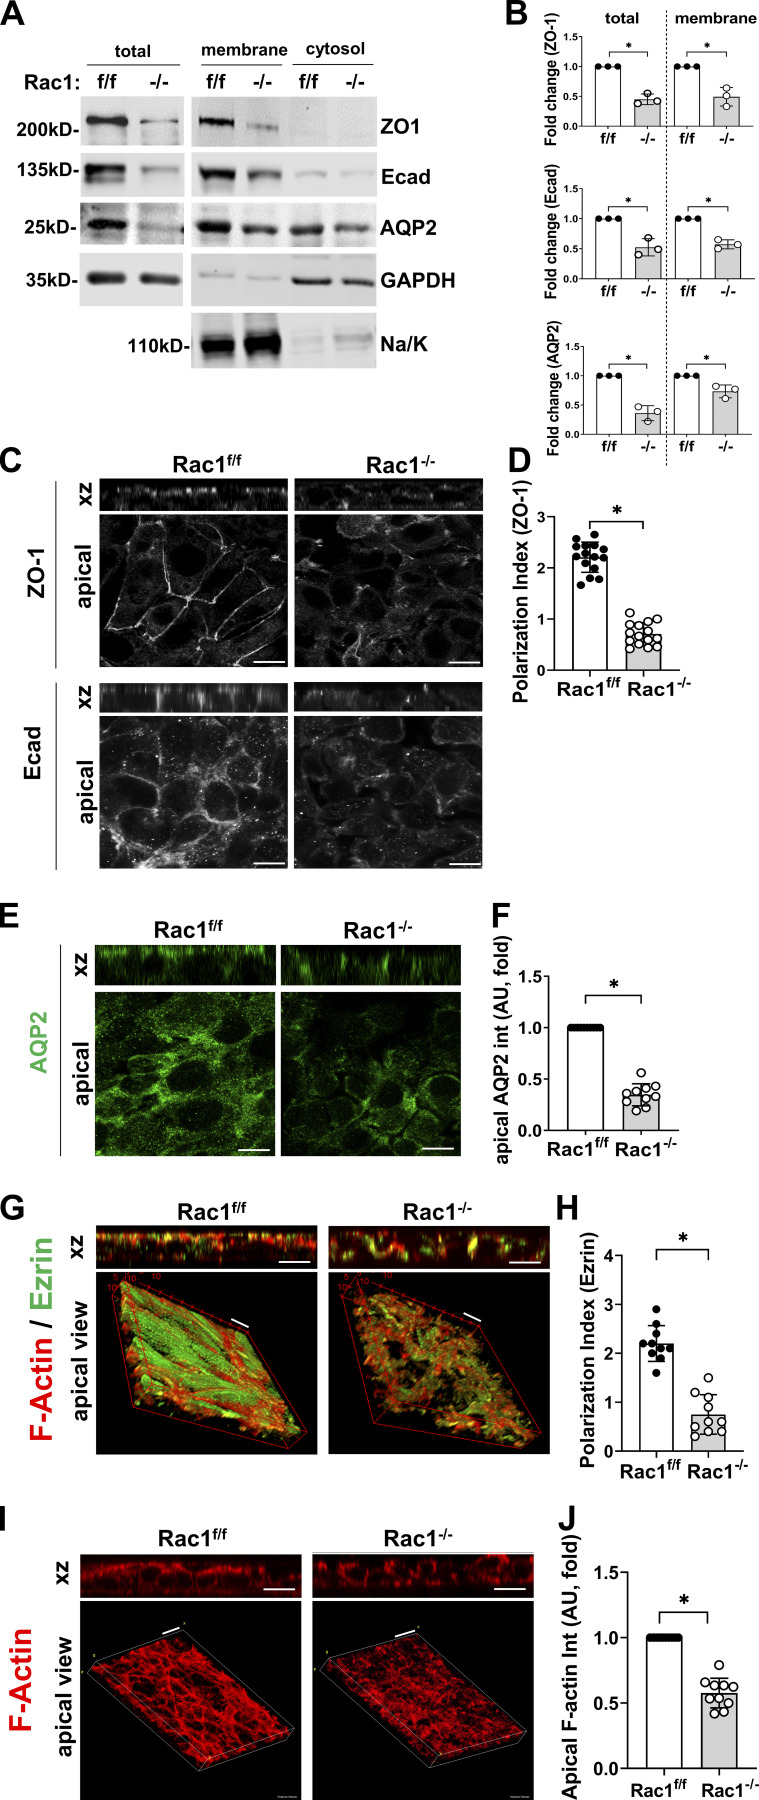
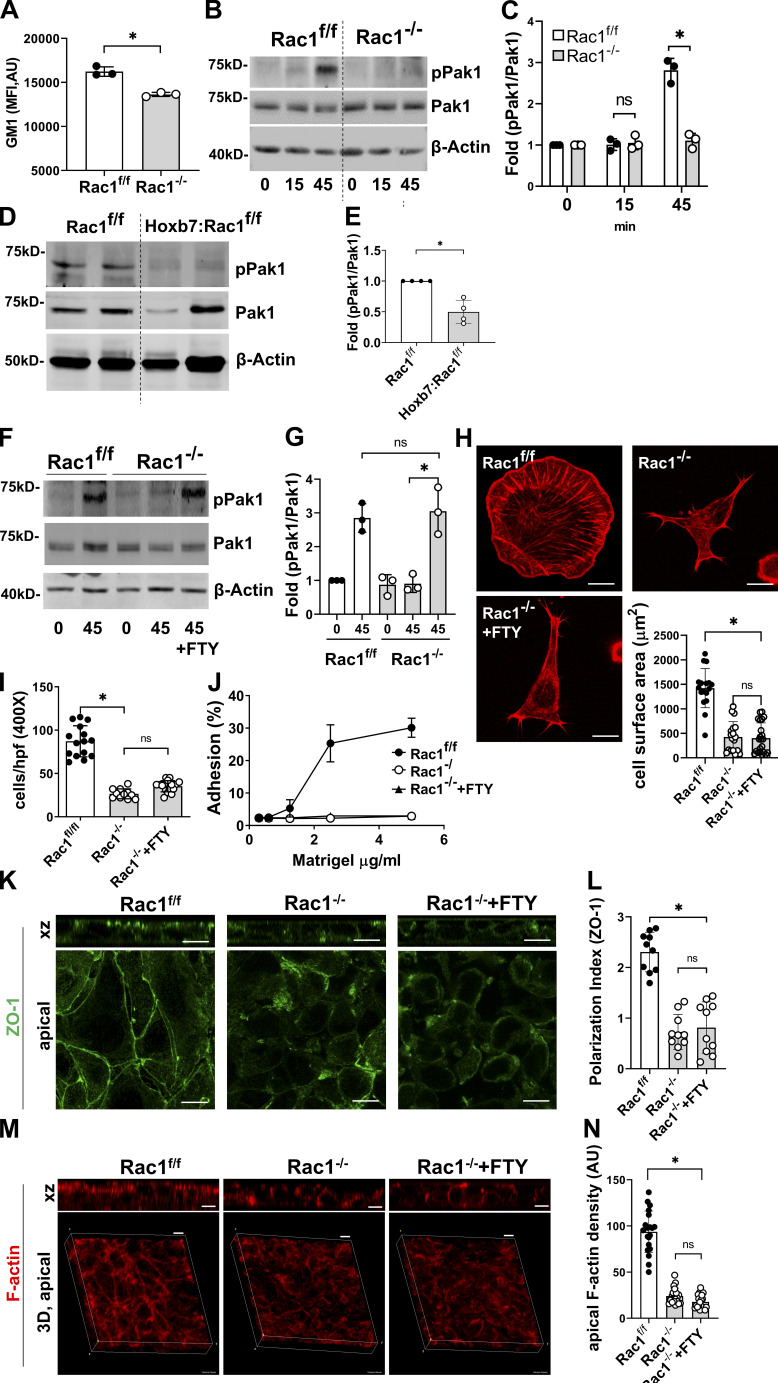
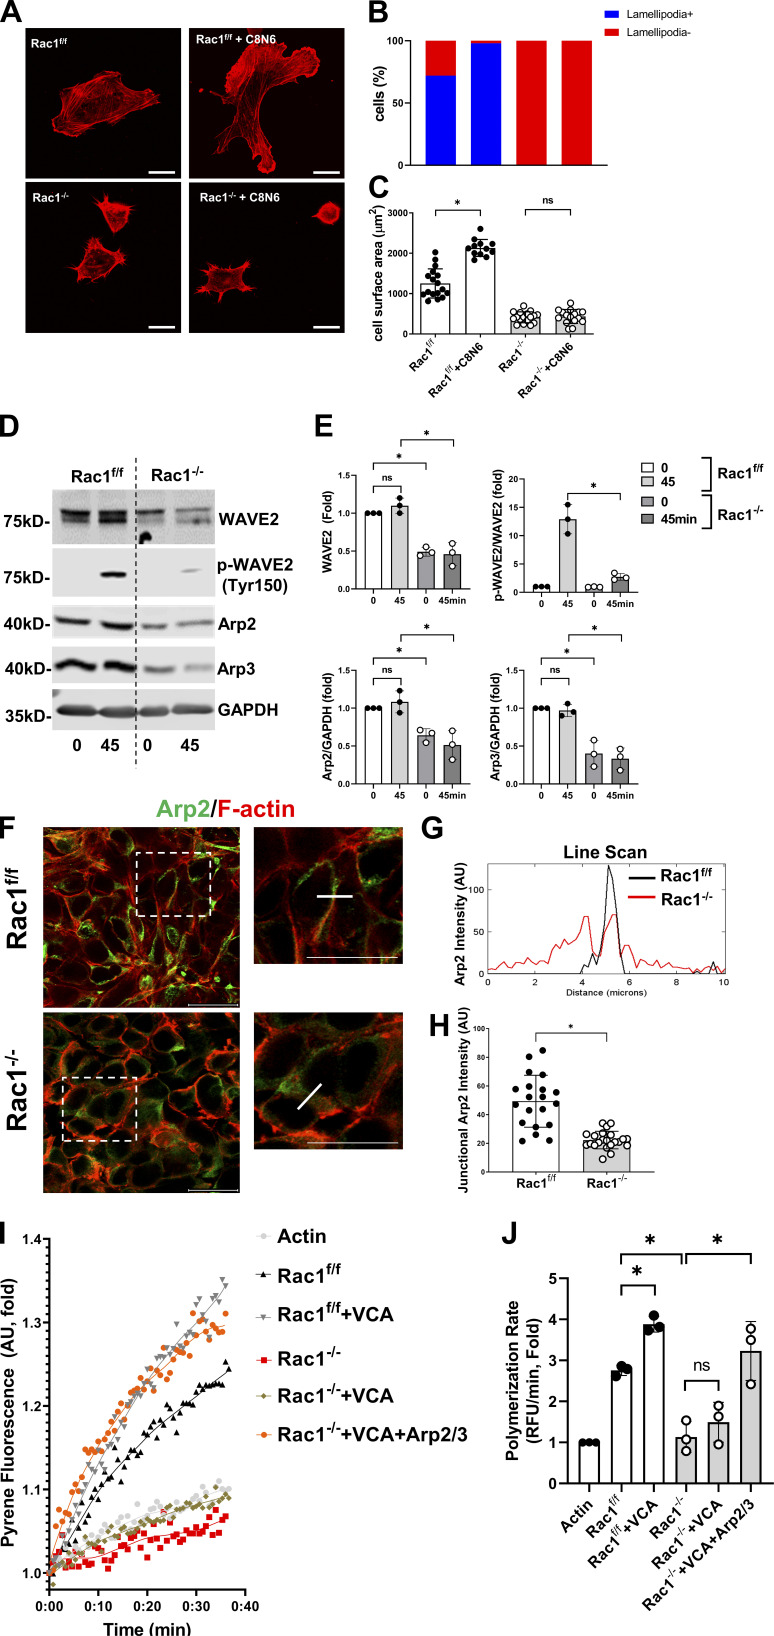
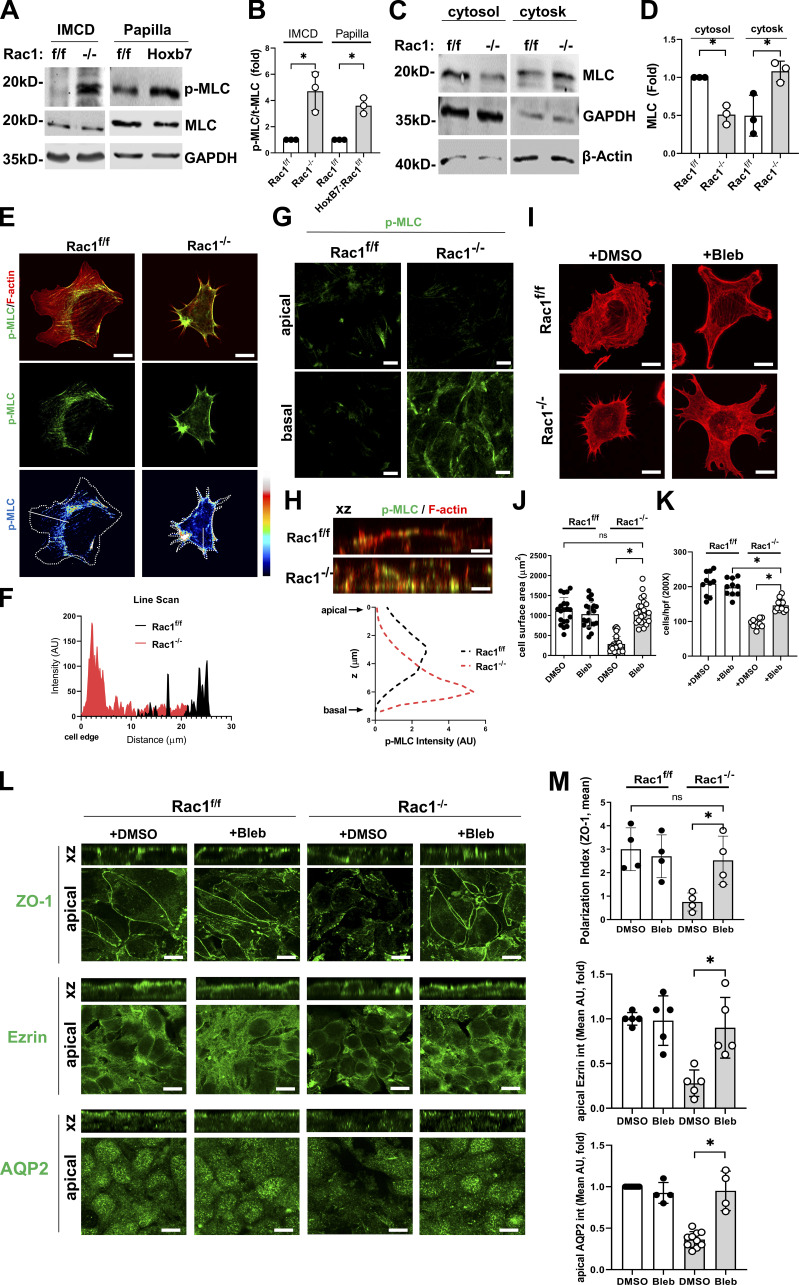
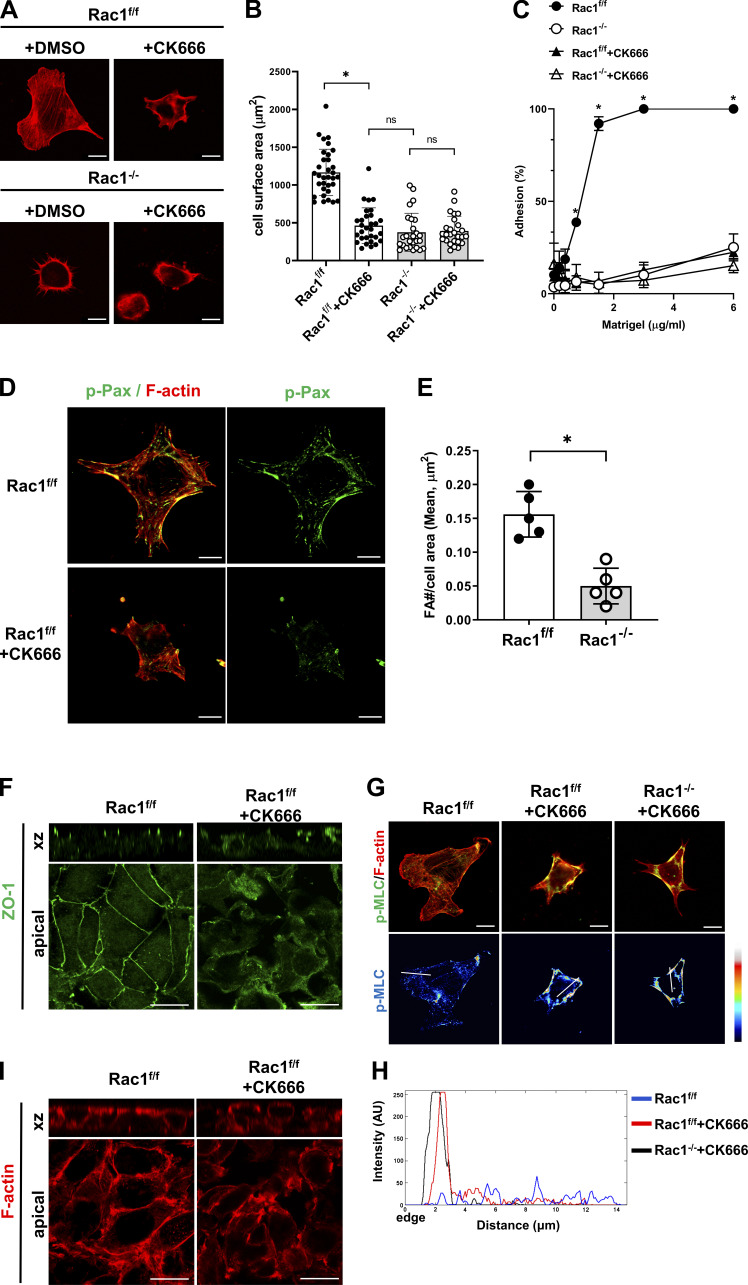
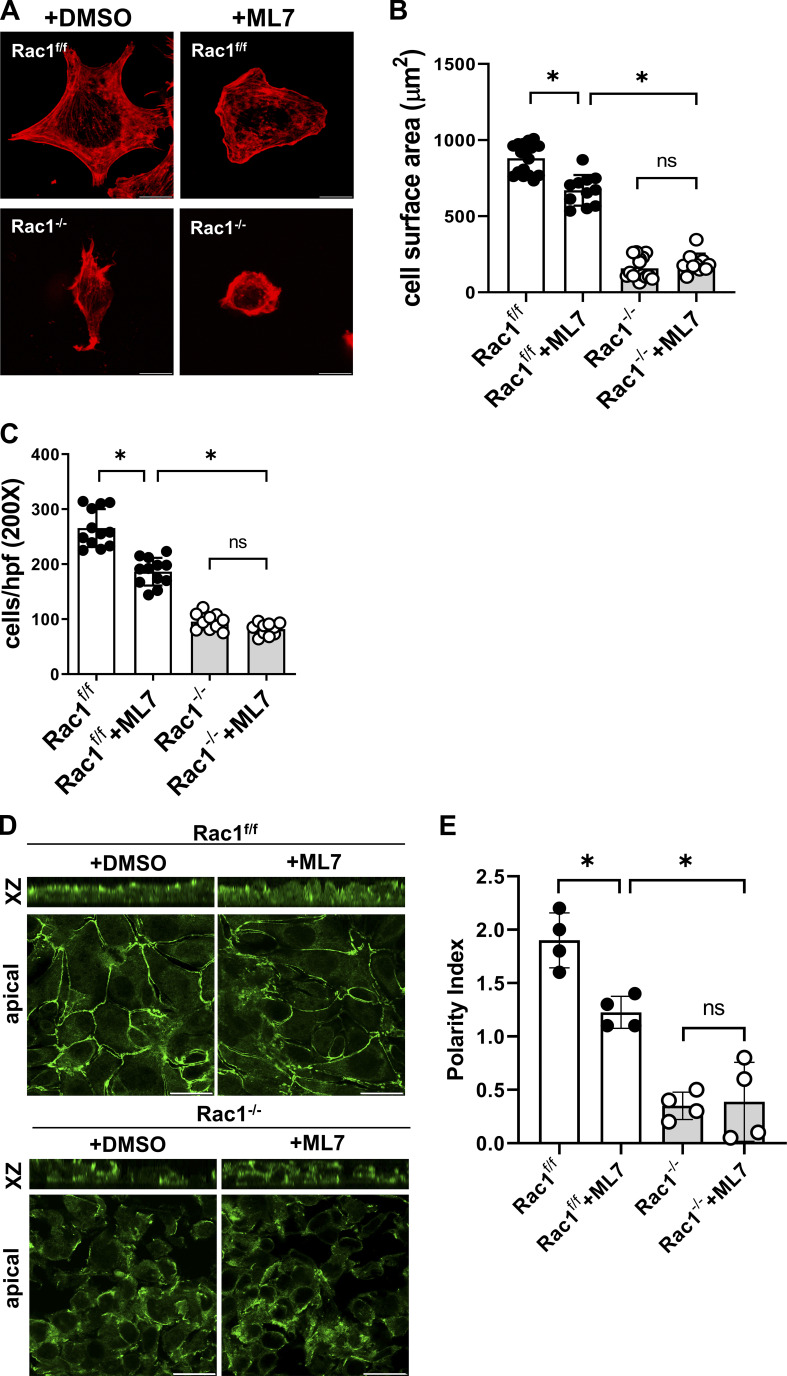
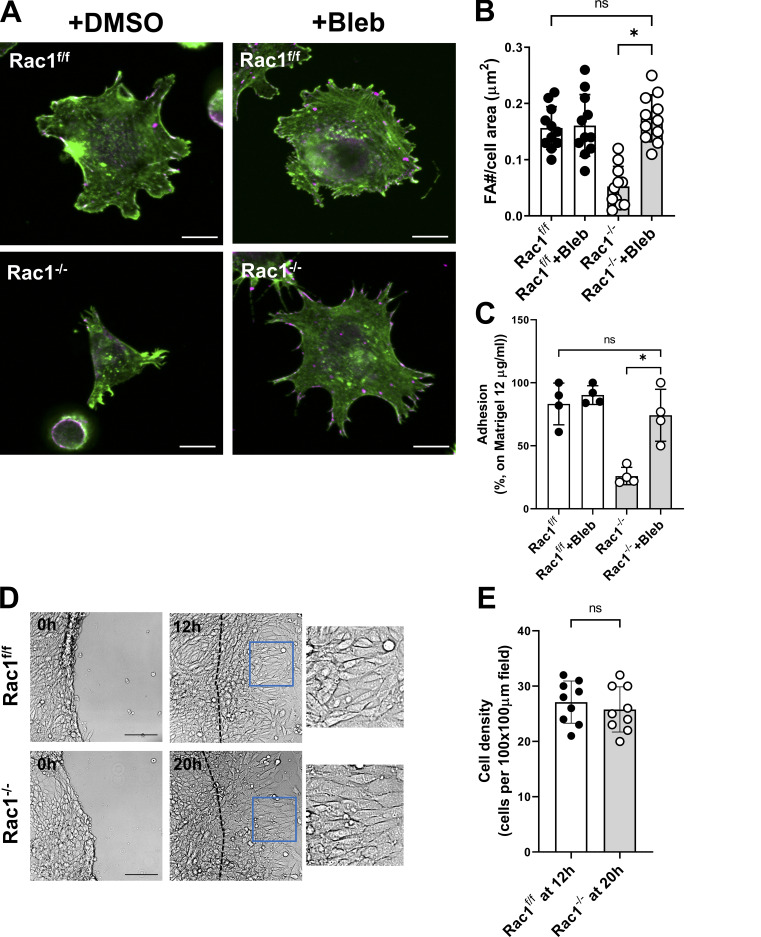
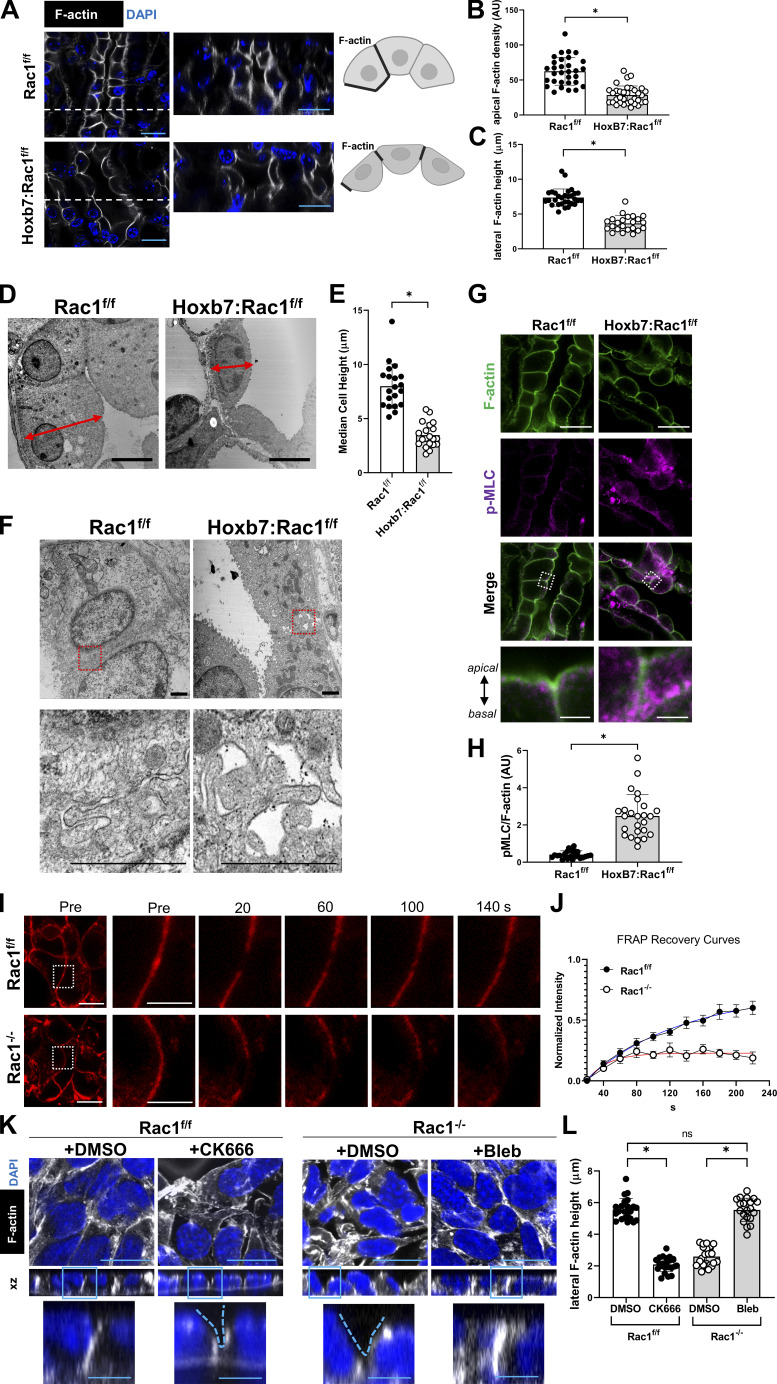
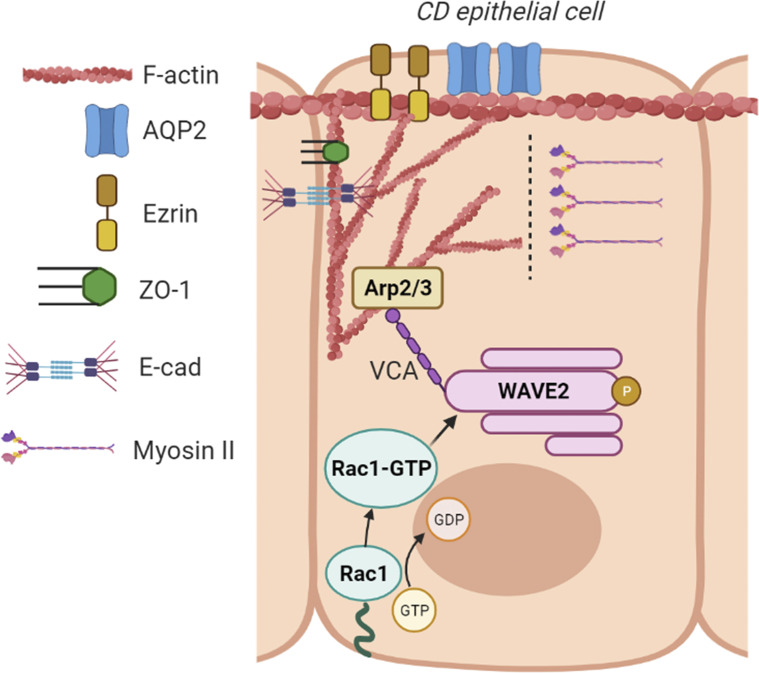
A polarized collecting duct (CD), formed from the branching ureteric bud (UB), is a prerequisite for an intact kidney. The small Rho GTPase Rac1 is critical for actin cytoskeletal regulation. We investigated the role of Rac1 in the kidney collecting system by selectively deleting it in mice at the initiation of UB development. The mice exhibited only a mild developmental phenotype; however, with aging, the CD developed a disruption of epithelial integrity and function. Despite intact integrin signaling, Rac1-null CD cells had profound adhesion and polarity abnormalities that were independent of the major downstream Rac1 effector, Pak1. These cells did however have a defect in the WAVE2-Arp2/3 actin nucleation and polymerization apparatus, resulting in actomyosin hyperactivity. The epithelial defects were reversible with direct myosin II inhibition. Furthermore, Rac1 controlled lateral membrane height and overall epithelial morphology by maintaining lateral F-actin and restricting actomyosin. Thus, Rac1 promotes CD epithelial integrity and morphology by restricting actomyosin via Arp2/3-dependent cytoskeletal branching.


Figures

Figure 1.
Figure 1.
Hoxb7:Rac1f/f kidneys are small, have more fibrosis, and have a urine concentration defect. (A) Rac1 expression in papillary lysates from 1-wk-old control mice (Rac1f/f) and Hoxb7:Rac1f/f mice was analyzed by immunoblotting. A representative immunoblot of four mice per group is shown. (B) Images of 6-mo-old Rac1f/f and Hoxb7:Rac1f/f kidneys. n = 5 mice per group. (C–E) Hematoxylin and eosin–stained paraffin kidney sections from 1-mo-old (C) and 6-mo-old (D) mice. Arrow in D (third row) indicates normal medullary epithelium, and arrowheads indicate epithelial cells growing on top of each other in the CD. n = 5 mice per group. Sirius red staining of 6-mo-old Hoxb7:Rac1f/f and Rac1f/f mice is shown in the bottom row. Five high-power fields per sample of red stained area in kidney cortex were quantified using ImageJ (E). Data were expressed as mean ± SEM. n = 5 mice per group. (F–H) Urine osmolality (F), body weight loss shown in Δweight (G), and 3-h urine volumes (H) are shown in Rac1f/f and Hoxb7:Rac1f/f mice following 24-h water deprivation. Data are expressed as mean ± SEM, n = 6–7 mice (F and G) or 4 mice (H) per group. Scale bars represent 200 µm (C), 100 µm (D, top row), 50 µm (D, second and third rows), and 100 µm (D, bottom row). *, P < 0.05.
Figure 2.
Figure 2.
Hoxb7:Rac1f/f kidneys have a mild developmental defect due to late Rac1 expression. (A) Hematoxylin and eosin–stained kidneys of Rac1f/f and Hoxb7:Rac1f/f mice at different stages of development (NB, newborn). Note that there are fewer and more dilated CDs starting at E18.5. n = 5 mice per group. (B and C) Rac1 immunostaining (magenta, single channel on the left) was performed on WT paraffin kidney sections and the UB labeled with E-cadherin (Ecad; green, merged with Rac1 in red on the right) at E15.5 (B) and at birth (NB; C), with a focused area highlighted by a white dashed box. n = 3 mice per group. (D and E) Rac1 (magenta) was evident in 6-wk-old WT mice (D) and human healthy adult (E) CDs labeled with FITC-conjugated DBA (green). n = 3 mice or 2 human samples per group. Scale bars represent 100 µm (A) and 20 µm (B–E).
Figure S1.
Figure S1.
Spatiotemporal assessment of Rac1 protein levels in control CDs. (A and B) Rac1 immunostaining (magenta) was performed on control (Rac1f/f; A) and Hoxb7:Rac1f/f (B) paraffin kidney sections of different ages and the UB/CD labeled with DBA (green). n = 3 mice per group. Scale bar represents 20 µm.
Figure 3.
Figure 3.
Adult Hoxb7:Rac1f/f CDs have a polarization and differentiation defect. (A and B) The CDs of newborn (A) and 6-mo-old adult (B) mice indicated were labeled with DBA (green) and stained for E-cadherin (Ecad, magenta) and imaged with confocal laser scanning microscopy. The bottom black and white panels are full-thickness maximum intensity projections of at least five z-stacks. (C) Rac1f/f and Hoxb7:Rac1f/f adult (4 mo) CDs (marked by DBA, green) were immunostained for Ezrin (magenta) and analyzed by confocal microscopy. n = 4 mice per group. (D) CDs (marked by DBA, green) from 4-mo-old control and Hoxb7:Rac1f/f mice were immunostained for acetylated tubulin (ac-Tub; magenta). Shown (C, D) are full-thickness maximum intensity projections of a minimum of five z-stacks. n = 3 mice per group. (E–G) Kidney sections of 4-mo-old mice were immunostained for the CD-specific water channel AQP2 (green; E). n = 3 mice per group. A representative apicobasal single-cell line-scan profile (as indicated by the dashed white line in the image in E) is shown in F. Quantification of apical AQP2 intensity using ImageJ of at least 15 CDs from 3 mice is shown in G. Values represent mean ± SD. (H–J) TEM was performed on inner medullary basement membranes (marked by a red asterisks; EC, epithelial cell) in the renal papilla of adult (10-mo-old) Rac1f/f and Hoxb7:Rac1f/f mice (H). and the thickness (in nanometers) was quantified at three randomly selected places per image (I). A minimum of 30 measurements per group is shown as mean ± SD (I). Renal papillae of adult (10-mo-old) Rac1f/f and Hoxb7:Rac1f/f mice were immunostained for laminin (α1 subunit, magenta), colabeled with phalloidin (green), and analyzed by confocal microscopy (J). n = 3 mice/group. Scale bars represent 10 µm (A and B), 5 µm (C–E), 1 µm (H, bottom row), 500 nm (H, top row), and 20 µm (J). AU, arbitrary units. *, P < 0.05.
Figure 4.
Figure 4.
Rac1−/− CD cells have tubulogenesis, adhesion, migration, and spreading defects despite normal integrin function. (A) Rac1 expression in adenoCre-treated Rac1f/f CD cells (Rac1−/−) was analyzed by immunoblotting. (B) Confocal image of tubule formation in a 3D MG gel of CD cells stained with rhodamine-phalloidin. (C) CD cell adhesion to different concentrations of MG at 1 h after plating was measured. Shown are means ± SEM. (D) CD cell transmigration across transwells coated with MG (20 µg/ml) was evaluated after 4 h from plating. Shown are individual values and means ± SD of 15 high-power fields per group. hpf, high-power field. (E and F) Rac1f/f and Rac1−/− CD cells were plated on MG and allowed to spread for 1 h, after which they were stained with rhodamine-phalloidin (E) and the spreading area was quantified using ImageJ. Mean ± SD and individual values of at least 20 cells are shown. (G and H) CD cells plated on MG for 1 h were immunostained with phospho-paxillin (P-Pax; magenta) and costained with rhodamine-phalloidin (green; G) and the focal adhesion number was counted using ImageJ and normalized to the cell area with values shown in mean ± SD of 10 individual cells (H). (I and J) Rac1f/f and Rac1−/− CD cells were either left in suspension or plated onto MG for 15 and 45 min and then immunoblotted for phosphorylated (p) and total FAK, Akt, Erk, and p38-MAPK or β-actin to verify equal protein loading (I). Three repeat experiments were quantified using densitometry (J) and shown as individual values and mean ± SD. The vertical white line for Erk/pErk separates samples that were rearranged from the same blot with a separate loading control as indicated. (K and L) Surface expression of integrin β1, α1, α2, α3, and α6 subunits was analyzed by FACS in Rac1f/f and Rac1−/− CD cells by using R-phycoerythrin conjugated secondary antibodies and shown as between-group fold change for each subunit as mean ± SD (K). Integrin activation was quantified by immunofluorescence staining for activated (9EG7) and total (Ha2/5) β1 integrins and calculating the surface ratio using ImageJ (L), and values represent mean ± SEM. A minimum of three experiments were performed throughout. Scale bars represent 50 µm (B) and 5 µm (E and G). *, P < 0.05.
Figure S2.
Figure S2.
Integrin activation, Rho GTPase activities in Rac1−/− CD cells and WAVE2/Arp2 levels in Rac1 deficient CDs in vivo. (A) CD cells were allowed to spread on MG for 1 h, after which they were stained for activated (9EG7) or total (Ha2/5) β1 integrin and analyzed by laser scanning confocal microscopy. Representative images taken close to the substrate are shown. (C and D) CD cells were replated on MG and lysed after 45 min, and activated RhoA or activated CdC42 was evaluated by pull-down assays (see Materials and methods). Activated and total RhoA and Cdc42 were analyzed by immunoblotting (A), and the ratio was calculated using densitometry in ImageJ (B). β-Actin was used to verify loading. Three experiments were performed (mean ± SD). (D and E) Rac1f/f and Hoxb7:Rac1f/f papillary lysates (20 µg/lane) were subjected to immunoblotting of WAVE2 and Arp2 (a core component of the Arp2/3 complex). A representative immunoblot is shown in D, and densitometric quantification using ImageJ of three mice per group is shown in E (mean ± SD). β-Tubulin was used to verify loading. Scale bar represents 10 µm (A). *, P < 0.05.
Figure 5.
Figure 5.
Rac1−/− CD monolayers have a defect in polarity and cytoskeletal organization. (A and B) Equal amounts of whole-cell lysates as well as membrane and cytosol fractions from Rac1f/f and Rac1−/− CD cells were immunoblotted for ZO-1, E-cadherin (Ecad), and AQP2. Na/K-ATPase and GAPDH were used to verify fraction purity. A representative immunoblot is shown (A), and experiments were quantified using densitometry (B) and shown as individual values and mean ± SD. (C–F) Rac1f/f and Rac1−/− CD cells were grown to confluent monolayers in transwells; immunostained for ZO-1, E-cadherin, and AQP2; and analyzed by confocal laser scanning microscopy with z-stacking. Shown are representative z-stacks in xz dimension (top panels) and apical cross sections (bottom panels). The polarization index (D) was quantified as described in Materials and methods, and apical AQP2 intensity (F) was quantified using ImageJ. (G–J) Rac1f/f and Rac1−/− CD monolayers were immunostained for Ezrin (green), and F-actin was labeled with rhodamine-phalloidin (red). Shown are confocal z-stacks in xz dimension (top panels) and 3D reconstructions (bottom panels). 3D reconstructions and quantifications of apical staining intensities (H and J) were done with ImageJ/Fiji with either the 3D or volume viewer plugin. Shown are representative images, and quantifications (D, F, H, and J) are in mean ± SD of at least 10 individual fields. A minimum of three experiments were performed throughout. Scale bars represent 10 µm (C, E, and G) and 15 µm (I). *, P < 0.05.
Figure 6.
Figure 6.
Morphological defects of Rac1−/− CD cells are not mediated by Pak1. (A) Surface expression of the lipid raft marker ganglioside GM1 was analyzed in Rac1f/f and Rac1−/− CD cells by flow cytometry using FITC-conjugated cholera toxin B subunit. Shown is the mean fluorescence intensity (MFI; mean ± SEM). (B–E) CD cells were either left in suspension or plated onto MG for the times indicated (min) and cell lysates were analyzed for levels of phosphorylated and total Pak1 (B). Renal papilla of adult (6 mo) Rac1f/f and Hoxb7:Rac1f/f mice were immunoblotted for phosphorylated and total Pak1 (D). Experiments or individual mice were quantified using densitometry and shown as individual values and mean ± SD in (C and E). (F and G) CD cells were treated with the Pak1 inducer FTY720 (1 µM) during replating on MG. Cells were harvested after 45 min, and levels of phosphorylated and total Pak1 were analyzed by immunoblotting (D). Experiments were quantified using densitometry and shown as individual values and mean ± SD (E). (H–J) Rac1f/f, Rac1−/−, and FTY720-treated Rac1−/− CD cells were plated on MG for 1 h and then stained with rhodamine-phalloidin to assess spreading (H), which was quantified in using ImageJ and shown as mean ± SD of at least 10 cells individual cells. Migration (4-h transwell assay toward MG) was analyzed and shown as mean ± SD of at least 10 fields (I), and adhesion on different concentrations of MG is shown as mean ± SEM of three experiments (J). (K–N) Rac1f/f, Rac1−/−, and FTY720-treated Rac1−/− CD cells grown to confluent monolayers in transwells were immunostained for ZO-1 (K, green) or labeled with rhodamine-phalloidin (M, red) and analyzed with confocal laser scanning microscopy. The polarization index was calculated using ImageJ as indicated in Materials and methods (mean ± SD; L). Shown are z-stacks in xz dimension (top panels, K and M) and apical cross sections (bottom panels, K) or 3D reconstructions of F-actin (bottom panels, M; ImageJ/Fiji volume viewer) with apical F-actin quantified in N (a minimum of 20 measurements shown; mean ± SD). A minimum of three experiments were performed throughout. Scale bars represent 10 µm (H, K, and M). *, P < 0.05.
Figure 7.
Figure 7.
Rac1 deficiency causes a defect in the WAVE2–Arp2/3 actin nucleation apparatus. (A–C) Untreated or C8N6-BPA (C8N6, 100 nM)–treated CD cells were allowed to spread on MG for 1 h, labeled with rhodamine-phalloidin (red), and analyzed with confocal laser scanning microscopy (A). Lamellipodia, expressed as percentage of cells with lamellipodia (10 high-power fields were analyzed per experiment; B), and cell area (10 cells per experiment were analyzed, expressed as mean ± SEM; C) were quantified using ImageJ/Fiji. (D and E) CD cells in suspension or replated on MG for 45 min were analyzed by immunoblotting for total and activated (pTyr150) WAVE2 and the actin nucleator complex subunits Arp2 and Arp3 (D). Quantification was done with densitometry using ImageJ (E; mean ± SEM). (F–H) CD cell monolayers were immunostained for Arp2 (green), and F-actin was costained with rhodamine-phalloidin (red; F). Line-scan profiling was performed and indicated by the white dotted line in (F) and the plot profile function of ImageJ was used (G). Line-scan profiles are representative of three repeat experiments with 10 junctions analyzed per experiment. Junctional Arp2 intensity was quantified (H), with a minimum of 20 measurements shown (mean ± SD). (I and J) CD cell lysate was added to the pyrene-actin polymerization assay together with purified Arp2/3 complex (10 nM) or VCA domain (400 nM). Kinetic pyrene fluorescence was recorded over the indicated time on a Spectramax iD3 plate reader. Rac1−/− cell lysate is unable to induce actin polymerization but can be rescued by the addition of Arp2/3 complex and VCA domain. A representative plot is shown (I), and the actin polymerization rate was calculated as indicated in Materials and methods (J). A minimum of three experiments were performed throughout. Scale bars represent 10 µm (A) and 20 µm (F). *, P < 0.05.
Figure 8.
Figure 8.
Actomyosin is dysregulated in Rac1−/− CDs, and the epithelial defects are rescued by myosin II inhibition. (A and B) Rac1f/f and Rac1−/− CD cellular lysates as well as Rac1f/f (f/f) and Hoxb7:Rac1f/f papillary lysates (Hoxb7) were immunoblotting for phosphorylated and total MLC. Quantification of three samples per group is shown in B (mean ± SD). IMCD, inner medullary collecting duct. (C and D) CD cell lysates were fractionated into the actin cytoskeletal and cytosolic fraction and subjected to immunoblotting for MLC. Quantification of repeat experiments (in mean ± SD and as individual values) is shown in D. (E and F) CD cells were allowed to spread on MG for 1 h and immunostained for p-MLC (green) and costained with rhodamine-phalloidin (red; E). Line-scan analysis was performed as indicated by the white line in the bottom panels using the ImageJ/Fiji plot profile function, and a representative profile of repeats (10 cells/experiment) is shown in F. (G and H) CD confluent monolayers were immunostained for p-MLC (green) and costained with rhodamine-phalloidin (red) and analyzed with confocal laser scanning microscopy with z-stacking. Representative apical and basal cross sections are shown in G, and representative z-stacks in xz dimension are shown in H. A representative apicobasal Z-profile generated with ImageJ’s Z-profile function is shown in H. (I–K) CD cells were treated with low-dose blebbistatin (5 µM) and allowed to spread on MG for 1 h (I and J) or subjected to a 4-h transwell migration assay (K). Spreading area was measured and migrated cells were counted using ImageJ. Representative rhodamine-phalloidin–stained cells (I), and data (mean ± SD) of repeat experiments are shown (J and K). Scatter plots indicate individual values of at least 20 cells (J) or 10 counted fields (K). (L and M) Blebbistatin (5 µM)–treated CD confluent monolayers were immunostained for ZO-1, Ezrin, and AQP2 (all in green) and analyzed with confocal laser scanning microscopy with z-stacking (L). The polarization index and apical staining intensity were quantified using ImageJ. Values shown are mean ± SD of repeat experiments (M). A minimum of three experiments were performed throughout. Scale bars represent 10 µm (E, G–I, and L). *, P < 0.05.
Figure S3.
Figure S3.
Arp2/3 inhibition in WT CD cells mimics Rac1 deficiency. (A and B) CD cells were treated with either DMSO or the Arp2/3 inhibitor CK666 (100 µM) and allowed to spread for 1 h on MG, after which they were fixed and labeled with rhodamine-phalloidin (red). Representative images are shown in A, and spreading area was quantified (B) using ImageJ/Fiji (10 cells/experiment, mean ± SD, 20–30 cells shown as individual values). (C) CD cells treated with either DMSO or the Arp2/3 inhibitor CK666 (100 µM) were allowed to adhere to different concentrations of MG. Cell adhesion was evaluated 1 h after plating. Values are mean ± SEM of three experiments. (D and E) Rac1f/f CD cells treated with CK666 (100 µM) were allowed to spread on MG (1 h), and focal adhesion number (phospho-paxillin, green) per cell area was analyzed in rhodamine-phalloidin (red)–labeled cells using confocal laser scanning microscopy (projection of full-thickness z-stacks) and quantified using ImageJ. Representative images are shown in D, and the mean ± SD is shown in E. (F) Rac1f/f CD cells, either untreated or treated with CK666 (100 µM), were grown to confluence on transwell inserts to induce polarization and stained for ZO-1 to assess apicobasal polarization. Immunofluorescence was analyzed using confocal laser scanning microscopy with z-stacking (a minimum of 10 stacks per image). Representative images are shown. The top panels show z-stacks in xz dimension, and the bottom panels show apical cross sections. (G and H) Rac1f/f cells, either untreated or treated with CK666 (100 µM) and Rac1−/− CD cells were allowed to spread on MG for 1 h and immunostained for p-MLC (green) and costained with rhodamine-phalloidin (red; G). Line-scan analysis was performed as indicated by the white line in the bottom panels using the ImageJ/Fiji plot profile function, and a representative profile (10 cells/experiment) is shown in H. (I) Rac1f/f cells, either untreated or treated with CK666 (100 µM), were grown to confluence on transwell inserts to induce polarization, and F-actin was labeled with rhodamine-phalloidin (red) and analyzed using confocal laser scanning microscopy with z-stacking. Representative images in xz dimension and apical cross sections are shown. A minimum of three experiments were performed throughout. Scale bars represent 10 µm (A, D, F, G, and I). *, P < 0.05.
Figure S4.
Figure S4.
MLCK inhibition does not rescue the Rac1 deficiency–induced epithelial defects. (A and B) CD cells were treated with either DMSO or the MLCK inhibitor ML-7 (50 µM) and allowed to spread for 1 h on MG, after which they were fixed and labeled with rhodamine-phalloidin (red). Representative images are shown in A, and spreading area was quantified (B) using ImageJ/Fiji (mean ± SD). (C) Untreated (DMSO) and ML-7–treated CD cells were plated on transwells coated with MG, and migration of DAPI-positive cells was evaluated after 4 h using the particle analyzer function in ImageJ (mean ± SD). Scatter plots indicate individual values for at least 10 cells (B) or at least 10 fields (C). Three experiments were performed (mean ± SD). (D and E) Untreated (DMSO) and ML-7–treated CD cells were grown to confluence on transwell inserts to induce polarization, stained for ZO-1 (green) to assess apicobasal polarization, and analyzed by confocal laser scanning microscopy. Representative images in xz dimension and apical cross sections are shown in D, and the polarization index was quantified in E (mean ± SD, four fields). A minimum of three experiments were performed throughout. Scale bars represent 10 µm (A) and 15 µm (D). *, P < 0.05.
Figure S5.
Figure S5.
Direct myosin II inhibition reverses the adhesion defect of Rac1-deficient CD cells. (A and B) CD cells were treated either with DMSO or the myosin inhibitor blebbistatin (Bleb; 5 µM) and allowed to spread for 1 h on MG, after which they were immunostained for the focal adhesion (FA) marker phospho-paxillin (magenta) and labeled with rhodamine-phalloidin (converted to green). Focal adhesion number per cell area was analyzed in using confocal laser scanning microscopy (projection of full-thickness z-stacks) and quantified using ImageJ. Representative images are shown in A, and the mean ± SD of at least 10 individual cells are shown in B. (C) Blebbistatin (5 µM)–treated CD cells were allowed to adhere to MG for 1 h, and adhesion was quantified as described in Materials and methods. Values are mean ± SD of at least 10 individual cells. (D and E) Control images corresponding to Fig. 9 K. Confluent Rac1f/f and Rac1−/− CD cells were wounded and allowed to migrate until cells had covered the highlighted scratch-adjacent areas (D). Cell density was quantified and shown as scatter plots with a minimum of nine quantified fields (E). A minimum of three experiments were performed throughout. Scale bars represent 10 µm (A) and 100 µm (D). *, P < 0.05.
Figure 9.
Figure 9.
Rac1 controls lateral F-actin, actin dynamics, and lateral membrane integrity, which is required for normal epithelial morphology. (A–C) Thick frozen sections of renal papillae of Rac1f/f and Hoxb7:Rac1f/f mice were optically cleared and labeled with phalloidin (white) and DAPI (blue) and analyzed with confocal microscopy (A). Z-stacks of a transverse (optical section shown as white dashed line) CD are shown on the right. (B and C) Apical F-actin and lateral F-actin height was quantified using ImageJ/Fiji. A minimum of 30 (B) or 20 (C) measurements is shown as scatter plot and mean ± SD. (D and E) TEM of inner medullary CD epithelial cells in the papilla of Rac1f/f and Hoxb7:Rac1f/f mice showing cell height measurements (D), which was quantified and expressed as scatter plot (a minimum of 20 measurements shown) with mean ± SD (E). n = 3 mice/group. (F) TEM of inner medullary collecting ducts in the papilla of Rac1f/f and Hoxb7:Rac1f/f mice showing regions of cell–cell contact (top panel) and a focused area highlighting the lateral cell membrane (bottom panel, red dashed box). (G and H) Frozen Rac1f/f and Hoxb7:Rac1f/f renal papillary sections were labeled with phalloidin-AF647 (green) and immunostained for p-MLC (magenta; G). Fluorescence intensity of p-MLC over phalloidin (F-actin) was quantified and expressed as scatter plot (a minimum of 25 measurements shown) with mean ± SD (H). n = 3 mice/group. (I and J) FRAP of F-actin (SiR-actin, red) at lateral cell–cell contacts of Rac1f/f and Rac1−/− CD cells in vitro (I). Recovery after photobleaching was quantified and curve fitted (J), mean ± SEM, n = 10. (K and L) Confluent Rac1f/f and Rac1−/− CD cells (treated with DMSO, CK666 100 µM, or blebbistatin 5 µM for 1 h before fixation) were wounded and allowed to migrate until cells had covered the highlighted scratch-adjacent areas as indicated in Fig. S5. Cells were then labeled with phalloidin-rhodamine (white) and (DAPI; K), and lateral F-actin height was quantified (L). n = 3 experiments and a minimum of 20 measurements (mean ± SD) are shown in L. Scale bars represent 15 µm (A and G), 3 µm (G, inset), 4 µm (D), 1 µm (F), 10 µm (I), 5 µm (I, inset), 15 µm (K), and 5 µm (K, inset). *, P < 0.05.
Figure 10.
Figure 10.
Schematic representation of the role of Rac1 in CD epithelial cells. Membrane-bound Rac1 is activated (Rac1-GTP) upon integrin binding to the ECM. Rac1-GTP directly binds to and activates the WAVE regulatory complex, leading to WAVE2 phosphorylation. This releases WAVE’s VCA domain, which binds to the actin nucleation complex Arp2/3 to initiate actin polymerization at branching points. The Rac1–WAVE2–Arp2/3 axis generates a branched actin cytoskeleton, which restricts myosin II access to the cytoskeleton. This is required for apical cytoskeletal (Ezrin), and junction stability (ZO-1 and E-cadherin [E-cad]), which are critical for epithelial functions that require apicobasal polarization (water transport via AQP2) and to maintain epithelial morphology. Created with biorender.com.

References

    1. Abella, J.V., Galloni C., Pernier J., Barry D.J., Kjær S., Carlier M.F., and Way M.. 2016. Isoform diversity in the Arp2/3 complex determines actin filament dynamics. Nat. Cell Biol. 18:76–86. 10.1038/ncb3286 - DOI - PubMed
    1. Aguilar-Aragon, M., Elbediwy A., Foglizzo V., Fletcher G.C., Li V.S.W., and Thompson B.J.. 2018. Pak1 Kinase Maintains Apical Membrane Identity in Epithelia. Cell Rep. 22:1639–1646. 10.1016/j.celrep.2018.01.060 - DOI - PMC - PubMed
    1. Akhtar, N., and Streuli C.H.. 2006. Rac1 links integrin-mediated adhesion to the control of lactational differentiation in mammary epithelia. J. Cell Biol. 173:781–793. 10.1083/jcb.200601059 - DOI - PMC - PubMed
    1. Berrier, A.L., Martinez R., Bokoch G.M., and LaFlamme S.E.. 2002. The integrin beta tail is required and sufficient to regulate adhesion signaling to Rac1. J. Cell Sci. 115:4285–4291. 10.1242/jcs.00109 - DOI - PubMed
    1. Bokoch, G.M., Reilly A.M., Daniels R.H., King C.C., Olivera A., Spiegel S., and Knaus U.G.. 1998. A GTPase-independent mechanism of p21-activated kinase activation. Regulation by sphingosine and other biologically active lipids. J. Biol. Chem. 273:8137–8144. 10.1074/jbc.273.14.8137 - DOI - PubMed

Publication types