Comparative Study
. 2017 Jan 5:7:40050.
doi: 10.1038/srep40050.

Comparative Transcriptome Profiles of Human Blood in Response to the Toll-like Receptor 4 Ligands Lipopolysaccharide and Monophosphoryl Lipid A

Affiliations
Comparative Study

Comparative Transcriptome Profiles of Human Blood in Response to the Toll-like Receptor 4 Ligands Lipopolysaccharide and Monophosphoryl Lipid A

Liming Luan et al. Sci Rep. .

Abstract

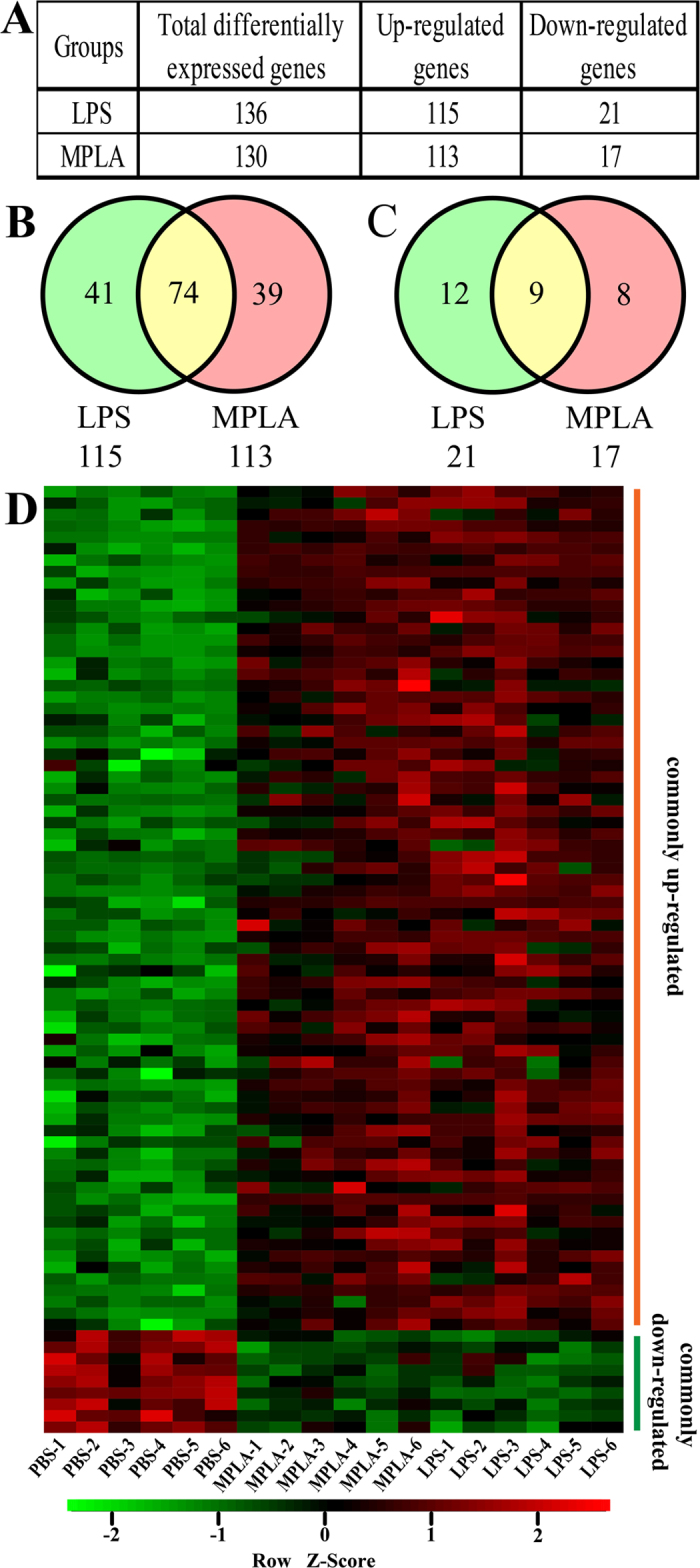
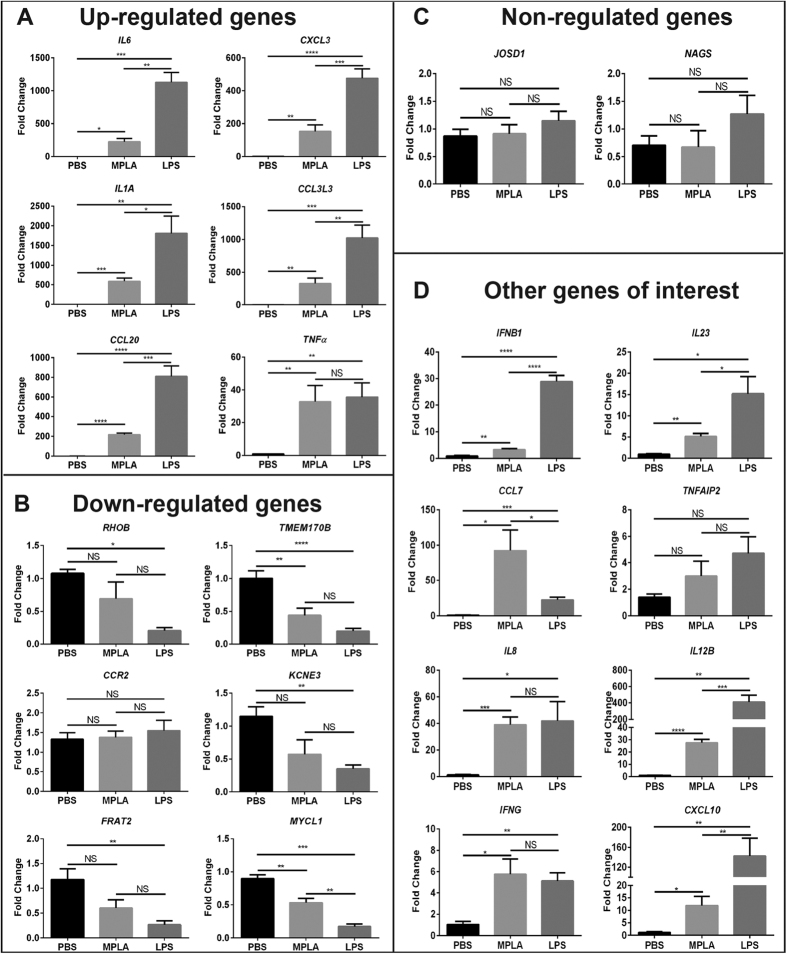
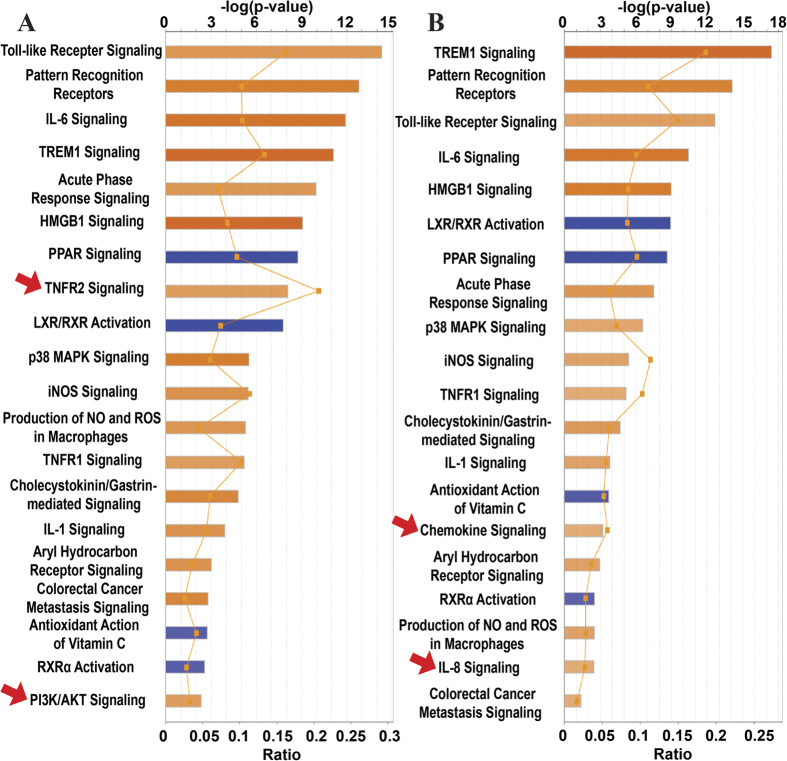
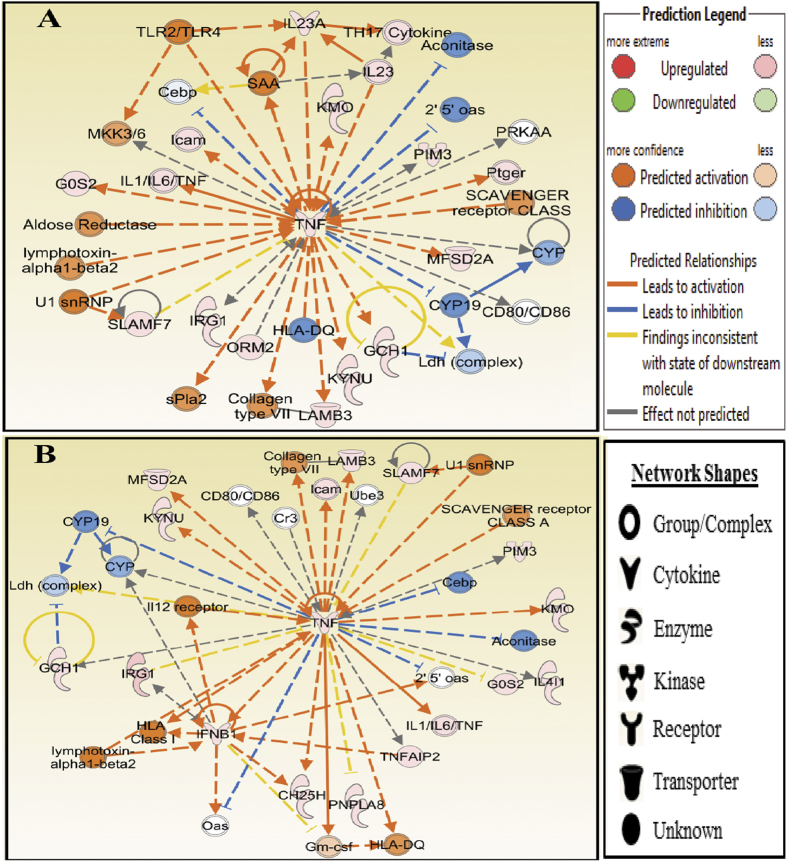
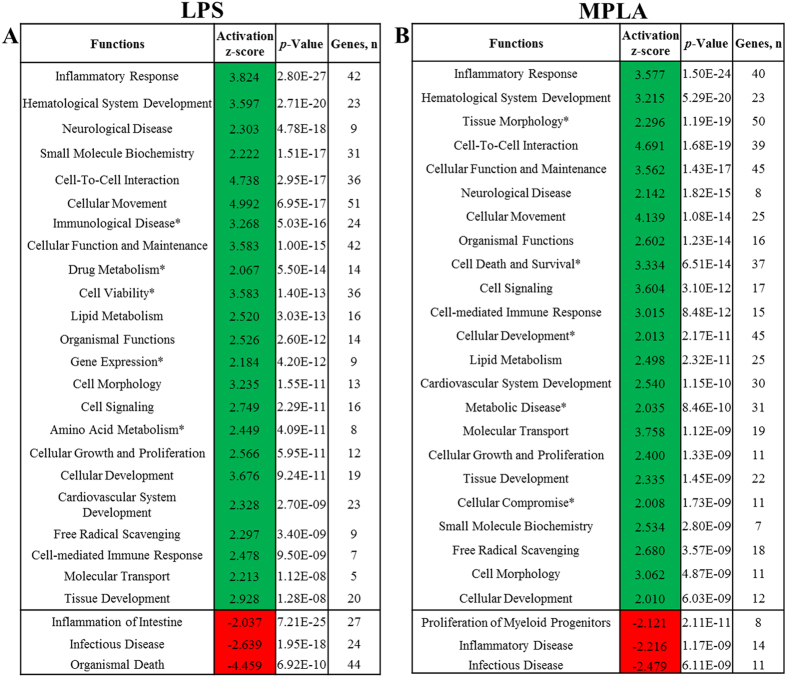
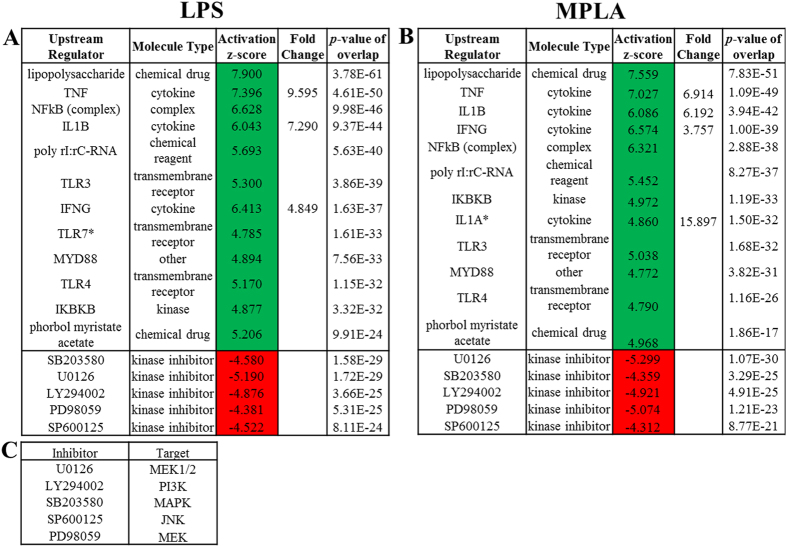
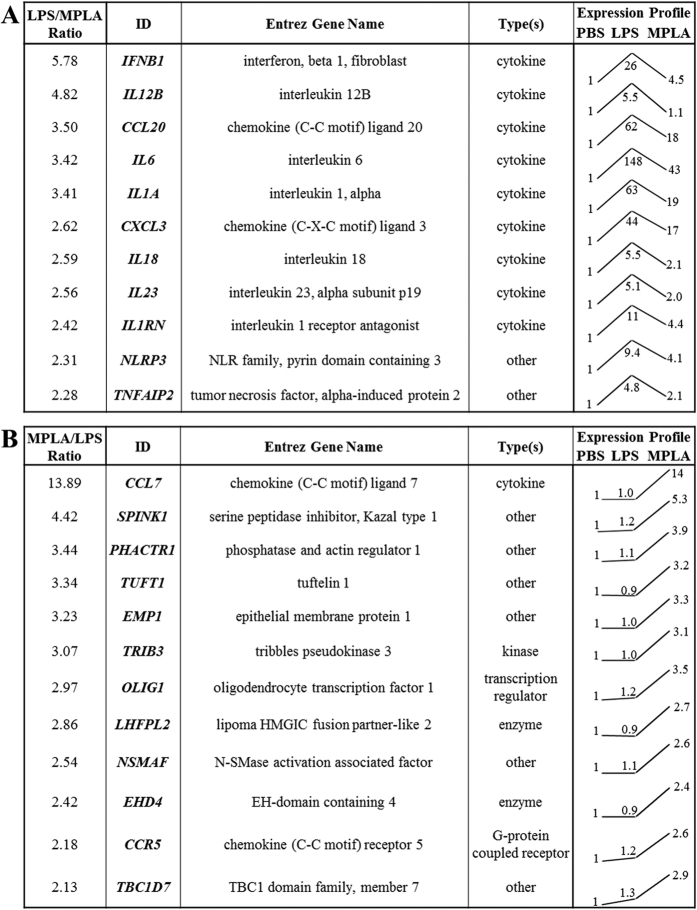
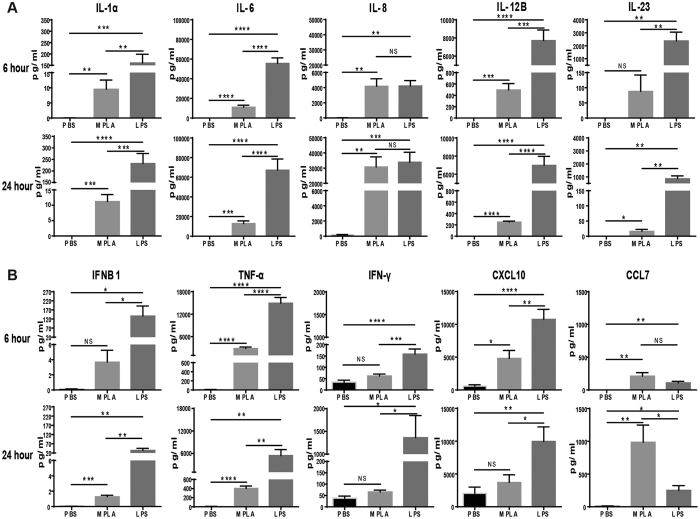
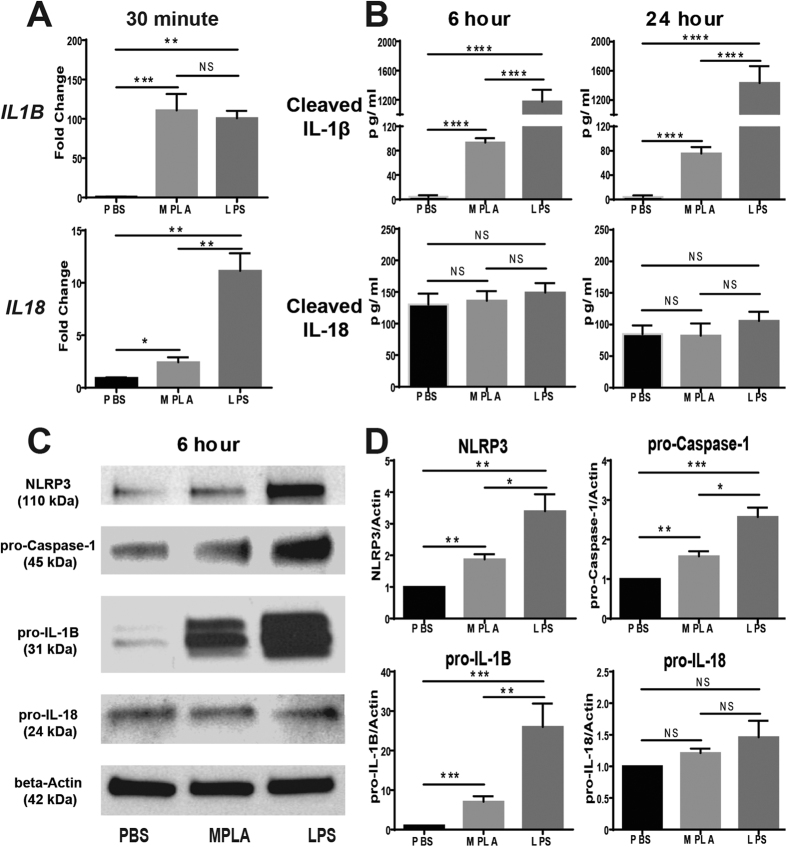
Monophosphoryl lipid A (MPLA), a less toxic derivative of lipopolysaccharide (LPS), is employed as a vaccine adjuvant and is under investigation as a non-specific immunomodulator. However, the differential response of human leukocytes to MPLA and LPS has not been well characterized. The goal of this study was to compare the differential transcriptomic response of human blood to LPS and MPLA. Venous blood from human volunteers was stimulated with LPS, MPLA or vehicle. Gene expression was determined using microarray analysis. Among 21,103 probes profiled, 136 and 130 genes were differentially regulated by LPS or MPLA, respectively. Seventy four genes were up-regulated and 9 were down-regulated by both ligands. The remaining genes were differentially induced by either agent. Ingenuity Pathway Analysis predicted that LPS and MPLA share similar upstream regulators and have comparable effects on canonical pathways and cellular functions. However, some pro-inflammatory cytokine and inflammasome-associated transcripts were more strongly induced by LPS. In contrast, only the macrophage-regulating chemokine CCL7 was preferentially up-regulated by MPLA. In conclusion, LPS and MPLA induce similar transcriptional profiles. However, LPS more potently induces pro-inflammatory cytokine and inflammasome-linked transcripts. Thus, MPLA is a less potent activator of the pro-inflammatory response but retains effective immunomodulatory activity.


Figures

Figure 1
Figure 1. Lipopolysaccharide and Monophosphoryl Lipid A Induce Similar Transcriptome Profiles in Human Blood.
(A) Numbers of differentially expressed genes after LPS or MPLA treatment. (B) Venn diagram indicating the overlap of genes that were significantly upregulated after LPS and MPLA treatment. (C) Venn diagram indicating the overlap of genes that were significantly downregulated after LPS and MPLA treatment. (D) Heat map of the hierarchical clustering of commonly regulated genes depicting their expression patterns and variation in human blood samples treated with LPS, MPLA, or vehicle control (PBS). The color key indicates the direction of changes, with red depicting genes significantly up-regulated and green showing genes significantly down-regulated. Genes were clustered based on their expression values across samples using Pearson correlation and complete linkage function.
Figure 2
Figure 2. Validation of Microarray Data by Quantitative Real-Time PCR.
(A) qPCR validation of six genes randomly chosen from top up-regulated genes in our genomic analysis. (B) qPCR validation of six genes randomly chosen from most down-regulated genes in our genomic analysis. (C) qPCR validation of two random non-regulated genes. (D) qPCR validation of eight genes of interest chosen based on their expression patterns. ΔΔCt values graphed are relative to the endogenous controls HPRT1 with SEM. *p < 0.05, **p < 0.01, ***p < 0.001, ****p < 0.0001, NS = not significant; n = 4 in each group, and qPCR was performed in triplicate.
Figure 3
Figure 3. Canonical Pathways Modulated by Differentially Expressed Genes after LPS or MPLA Treatment.
Ingenuity pathway analysis showing significantly altered canonical pathways modulated by the 136 and 130 differentially expressed genes after LPS (A) and MPLA (B) treatment, respectively. The pathways are indicated on the y-axis. On the x-axis, the significance score (negative log of P-value calculated using Fisher exact test) for each pathway is indicated by the bars, and the line represents the ratio of genes in a given pathway that meet the cut-off criteria among total genes that make up that pathway. The bars in the chart are colored to indicate their activation z-scores. Orange bars predict an overall increase in the activity of the pathway while blue bars indicate a prediction of an overall decrease in activity. The entries that have a −log (p-value) greater than 1.3 and an absolute z-score value greater than 2 are displayed. Arrows, the pathways that are activated by LPS or MPLA only.
Figure 4
Figure 4. Tumor Necrosis Factor-alpha (TNF-α) Networks Identified by Ingenuity Analysis in LPS and MPLA Treated Human Blood.
The molecular network of TNF-α identified via Ingenuity analysis in LPS (A) and MPLA (B) treated groups. The analysis was performed in silico using Molecular Activity Predictor analysis of IPA. The genes are represented as colored nodes. The red nodes represent the upregulated genes, while the blue nodes represent the downregulated genes. Color intensity reflects magnitude of change. Genes without color were not affected by the treatment. The network diagram shows the biological relationship between the indicated genes lines: — represents direct physical interactions; ----- represents indirect functional interactions; → represents activation; ┤represents inhibition. The blue lines indicate that the direction of regulation is consistent with IPA prediction. In contrast, yellow lines indicate that the regulation observed is inconsistent with expectations, while grey lines indicate lack of pre-existing data to formulate expectations. Nodes are displayed using various shapes that represent the functional class of the genes.
Figure 5
Figure 5. Functional Analysis.
Differentially expressed genes in LPS (A) and MPLA (B) treated human blood were used for Functional analysis in IPA software. Only functional annotations that obtained a Regulation z-score value higher than the absolute value of 2, which is considered significant and therefore for which IPA could predict the Activation State, are presented. Green indicates functions that were up-regulated and red indicates functions that were down-regulated. Asterisks, the functions that are activated by LPS or MPLA only. P-value < 0.05 calculated by Fisher’s Exact test; “Genes, n” = number of genes associated to annotation in our datasets.
Figure 6
Figure 6. Upstream Analysis.
The top 12 activated and top 5 inhibited upstream regulators in LPS- (A) or MPLA-treated (B) human blood predicated by Upstream analysis in IPA software are shown in the table. The prediction of activation state is based on the global direction of changes of the modulated genes. The activation Z-score, which indicates whether the observed gene responses to upstream regulators agree with expected changes derived from the literature that accrued in the Ingenuity® Knowledge Base, was used to predict the activation state. Z-scores ≥ 2 or ≤ −2 indicates that the upstream regulator was predicted to be activated or inhibited, respectively. A Fisher’s Exact Test was used to determine the significance of the overlap between the regulator and the LPS- and MPLA-responsive genes. The targets of the inhibitors are listed (C). Asterisks, the upstream regulators that are activated by LPS or MPLA only.
Figure 7
Figure 7. Comparison of Genes Induced by LPS and MPLA.
Eleven more strongly induced genes by LPS (A) and twelve more preferentially modulated genes by MPLA (B) are shown in the tables. Normalized intensity value of each gene from microarray hybridization profiles were further normalized to that of the corresponding PBS sample, and then the relative expression trend was shown as a line among the 3 groups (PBS, LPS, and MPLA). The relative expression ratio for each gene between the two treatments was further calculated, and only the genes with a ratio of 2 or over were displayed.
Figure 8
Figure 8. Cytokine Production by Human Peripheral Blood Mononuclear Cells (PBMC) After LPS or MPLA Treatments.
PBMC were incubated in media supplemented with PBS, LPS or MPLA for 6 or 24 hours at 37 °C. Several interleukins (A) and cytokines (B) of interest were measured by ELISA and Bio-Plex analysis. *p < 0.05, **p < 0.01, ***p < 0.001, ****p < 0.0001, NS = not significant; n = 4 in each group, and data are representatives of three independent experiments.
Figure 9
Figure 9. Expression of Inflammasome Components in Human PBMCs Treated with LPS or MPLA.
(A) Gene expression of IL1B and IL18 in human PBMCs 30 minutes after LPS or MPLA treatment. (B) Levels of cleaved IL-1β and IL-18 produced by human PBMCs 6 and 24 hours after LPS or MPLA treatment. (C) Expression of NLRP3 (110 kDa) and precursors of Caspase-1 (45 kDa), IL-1B (31 kDa), and IL-18 (24 kDa) in human PBMCs 6 hours after LPS or MPLA treatments. Gels have been cropped for clarity; the bands were confirmed by the comparison with full-length gel images and molecular weight (Supplementary Figure S8). (D) Densitometry analysis of the Western Blot results. *p < 0.05, **p < 0.01, ***p < 0.001, ****p < 0.0001, NS = not significant; n = 4 in each group, and data are representatives of three independent experiments.

References

    1. Raetz C. R. et al. Gram-negative endotoxin: an extraordinary lipid with profound effects on eukaryotic signal transduction. Faseb J 5, 2652–2660 (1991). - PubMed
    1. Raetz C. R. & Whitfield C. Lipopolysaccharide endotoxins. Annu Rev Biochem 71, 635–700, doi: 10.1146/annurev.biochem.71.110601.135414 (2002). - DOI - PMC - PubMed
    1. Caroff M., Karibian D., Cavaillon J. M. & Haeffner-Cavaillon N. Structural and functional analyses of bacterial lipopolysaccharides. Microbes Infect 4, 915–926 (2002). - PubMed
    1. Bohannon J. K., Hernandez A., Enkhbaatar P., Adams W. L. & Sherwood E. R. The immunobiology of toll-like receptor 4 agonists: from endotoxin tolerance to immunoadjuvants. Shock 40, 451–462, doi: 10.1097/SHK.0000000000000042 (2013). - DOI - PMC - PubMed
    1. Schweizer H. P. Understanding efflux in Gram-negative bacteria: opportunities for drug discovery. Expert opinion on drug discovery 7, 633–642, doi: 10.1517/17460441.2012.688949 (2012). - DOI - PubMed

Publication types