. 2020 Nov;18(11):1735-1743.
doi: 10.1158/1541-7786.MCR-20-0075. Epub 2020 Aug 4.

Phosphorylation of PLCγ1 by EphA2 Receptor Tyrosine Kinase Promotes Tumor Growth in Lung Cancer

Affiliations

Phosphorylation of PLCγ1 by EphA2 Receptor Tyrosine Kinase Promotes Tumor Growth in Lung Cancer

Wenqiang Song et al. Mol Cancer Res. 2020 Nov.

Abstract

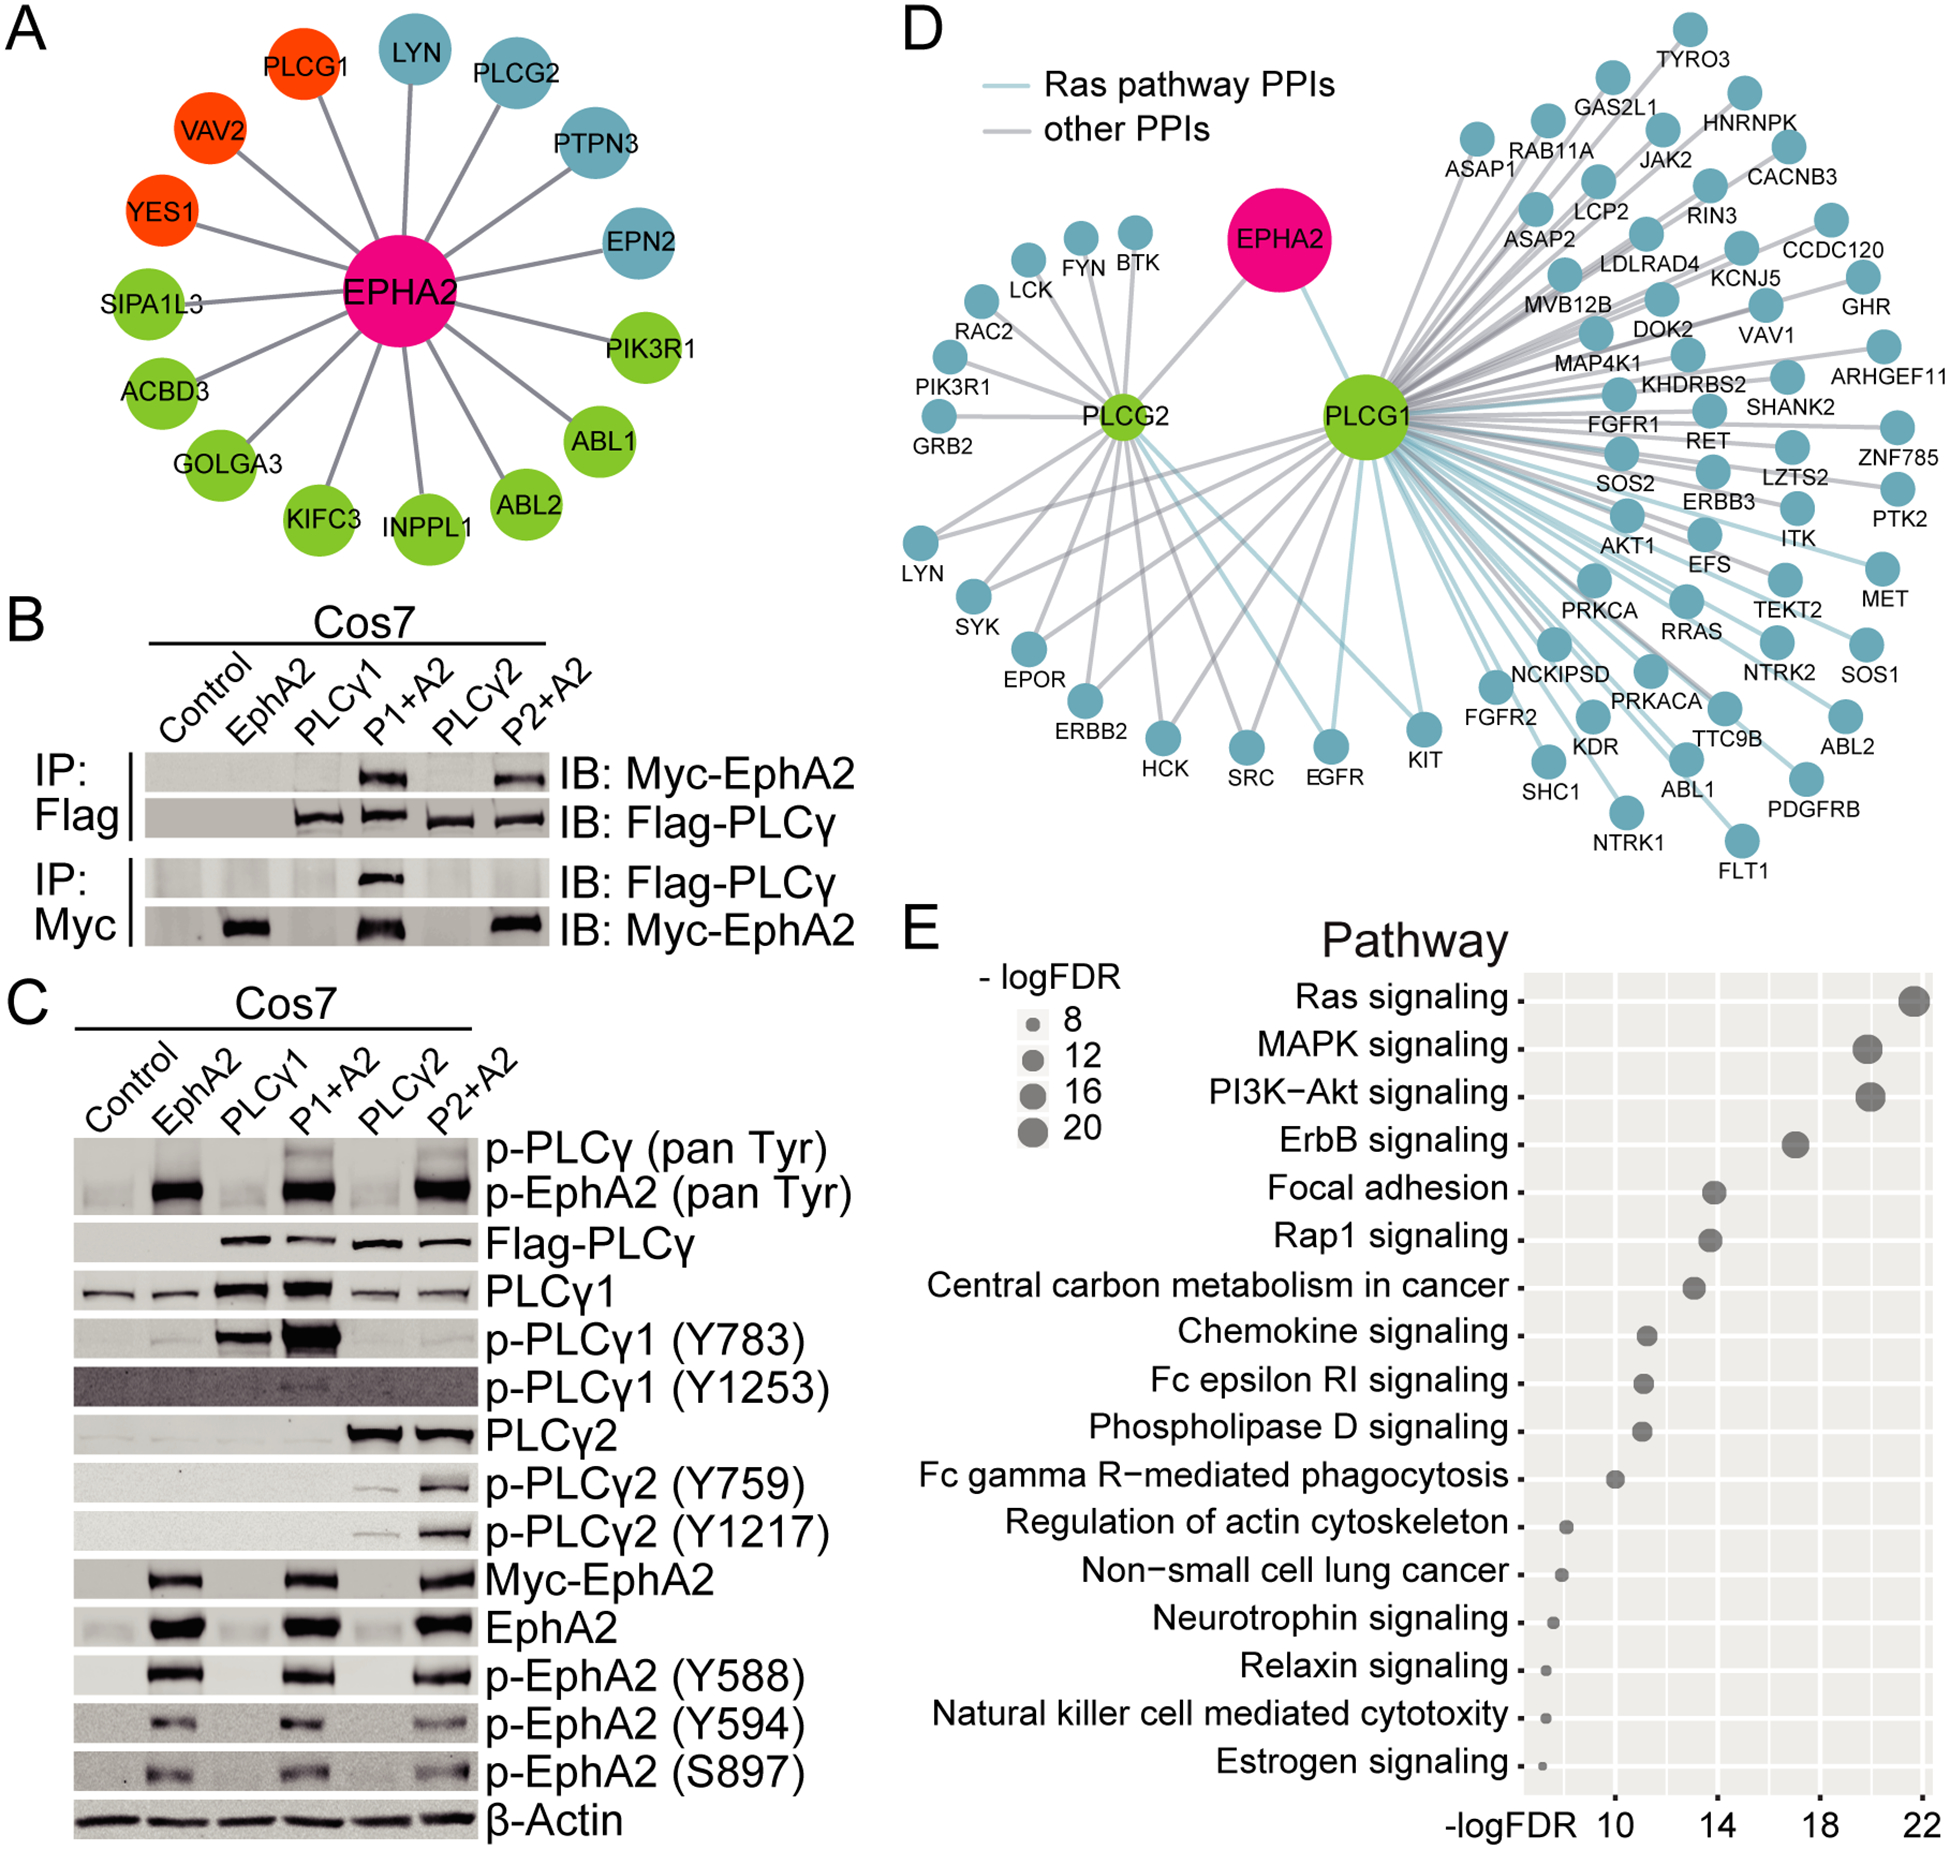
EphA2 receptor tyrosine kinase (RTK) is often expressed at high levels in cancer and has been shown to regulate tumor growth and metastasis across multiple tumor types, including non-small cell lung cancer. A number of signaling pathways downstream of EphA2 RTK have been identified; however, mechanisms of EphA2 proximal downstream signals are less well characterized. In this study, we used a yeast-two-hybrid screen to identify phospholipase C gamma 1 (PLCγ1) as a novel EphA2 interactor. EphA2 interacts with PLCγ1 and the kinase activity of EphA2 was required for phosphorylation of PLCγ1. In human lung cancer cells, genetic or pharmacologic inhibition of EphA2 decreased phosphorylation of PLCγ1 and loss of PLCγ1 inhibited tumor cell growth in vitro. Knockout of PLCγ1 by CRISPR-mediated genome editing also impaired tumor growth in a KrasG12D-p53-Lkb1 murine lung tumor model. Collectively, these data show that the EphA2-PLCγ1 signaling axis promotes tumor growth of lung cancer and provides rationale for disruption of this signaling axis as a potential therapeutic option. IMPLICATIONS: The EphA2-PLCG1 signaling axis promotes tumor growth of non-small cell lung cancer and can potentially be targeted as a therapeutic option.


Conflict of interest statement

The authors declare that they have no conflict of interest.

Figures

Figure 1.
Figure 1.. EphA2 interacts with PLCγ.
(A) A yeast-two-hybrid screen identified potential EphA2 interactors based on a lung cancer cDNA library. Orange, very high confidence; Blue, high confidence; Green, moderate confidence. (B&C) Combinations of EphA2 and either PLCG1 or PLCG2 were expressed in COS-7 cells. (B) Flag-PLCγ or Myc-EphA2 were immunoprecipitated and co-immunoprecipitating EphA2 or PLCγ was probed by western blotting. (C) Phosphorylation levels of EphA2 and PLCγ were measured by western blotting. (D) Map of the human EphA2-PLCγ1/PLCγ2 subnetwork analysis. Proteins in the Ras pathway are delineated by a blue line. (E) KEGG pathway enrichment analysis of the PLCγ interactome. FDR, False Discovery Rate.
Figure 2.
Figure 2.. EphA2 kinase activity is required for phosphorylation of PLCγ.
Wild-type (wt) or mutant EphA2 was expressed in COS-7 or BEAS2B cells to assess their ability to phosphorylate PLCγ1. (A) Diagram showing the domains of EphA2 and the mutants used in the following experiments. (B) Whole cell lysates of COS-7 cells 48 hours post-transfection were analyzed by western blotting for phosphorylation of EphA2 and PLCγ1. (C) Quantification of the ratio of phospho-PLCγ to total PLCγ in EphA2 and PLCγ co-expressing cells from two independent experiments. p/t, phospho/total. (D) PLCG1 and EphA2 were co-transfected into COS-7 cells at a ratio of 1:0.1, 1:0.2, 1:0.4, and 1:1 and whole cell lysates were collected 48 hours post-transfection. Lysates were analyzed by western blotting and quantified in the bottom panel. (E) BEAS2B cells overexpressing EphA2 were cultured for 48 hours in growth medium or serum-starved and FBS-stimulated for 10 min before collection of lysates. Whole cell lysates were analyzed by western blotting using the indicated antibodies.
Figure 3.
Figure 3.. PLCγ1 is activated by EphA2 in human lung cancer cell lines.
PLCγ1 activity was evaluated by its Y783 phosphorylation in human KRAS-mutant lines. A2: EphA2; P1: PLCγ1. (A) Wild-type or kinase dead (KD) EphA2 was expressed in H23 cells. Cells were serum-starved and FBS-stimulated for 10 min and whole cell lysates were analyzed by western blotting with the indicated antibodies. (B&C) EphA2 was knocked down by pooled siRNA in the indicated cell lines and whole cell lysates were analyzed by western blotting. (B) H23 cells were serum-starved and stimulated with FBS for 10 or 30 minutes. (C) Cell lines were cultured in complete growth media for 24 hours post-transfection. (D) EphA2 was knocked down by two different shRNA sequences (#1 and #2) in H23 and H2009 cell lines which were serum-starved and stimulated with FBS for 10 minutes. Whole cell lysates were analyzed by western blotting with the indicated antibodies. (E) H23 and H2009 cell lines were stimulated with IgG-Fc or Ephrin-A1-Fc for 10 or 20 min. Whole cell lysates were analyzed by western blotting with the indicated antibodies. (F) H23 shGFP control or shEphA2 (sequence #1) knockdown cells were stimulated with IgG-Fc or Ephrin-A1-Fc for 10 min. Whole cell lysates were analyzed by western blotting with the indicated antibodies. (G) H23 or H2009 cells were treated with increasing concentrations of ALW for 24 hours. Whole cell lysates were analyzed by western blotting with the indicated antibodies. (H&I) Endogenous interactions between EphA2 and PLCγ1 in H23 and H2009 cells were analyzed by Duolink proximity ligation assay (PLA) in shGFP control cells compared to either shEphA2 or shPLCG1 knockdown cells. PLA signals (dots) were quantified from 3–6 40× fields. Data are presented as mean ± SD. *, p<0.05, Student’s t-test. (J) IgG or PLCγ1 immunoprecipitates and whole cell lysates from H23 shGFP control or shEphA2 cells were assessed by western blotting with the indicated antibodies.
Figure 4.
Figure 4.. PLCγ1 loss inhibits human KRAS-mutant lung cancer cell growth.
(A) Western blot of PLCγ1 levels in H23 cells upon siPLCG1 targeting. (B) Cell viability of H23 and H2009 cells upon knockdown of PLCG1 by siRNA was measured by MTT assay. Representative data are presented as mean ± SD. **, p<0.01; ***, p<0.001, Student’s t-test. (C) Western blot of PLCγ1 levels in H23 and H2009 cells upon knockdown of PLCG1 by shRNA. (D) MTT assays measuring the relative cell viability of H23 and H2009 upon targeting of PLCG1 by shRNA. Representative data are presented as mean ± SD. ***, p<0.001, Two-way ANOVA with Tukey’s post hoc correction for multiple comparisons. (E) Colony growth of shGFP or shPLCG1 H23 and H2009 cells. Quantification of colony area below. Representative data are presented as mean ± SD. ***, p<0.001, Student’s t-test. (F) Western blot of H23 cells upon targeting of PLCG1 by CRISPR-Cas9 mediated genome editing. (G) Colony growth of sgLacZ or sgPLCG1 H23 cells. Quantification of colony area below. Representative data are presented as mean ± SD. **, p<0.01; ***, p<0.001, Student’s t-test.
Figure 5.
Figure 5.. PLCγ1 deficiency hinders mouse KPL lung tumor growth.
(A) Schematic of AAV vector used for expression of sgKras, sgp53, sgLkb1, Cre and KrasG12D template. (B) MRI images of tumor formation in KPL mice up to 3 months after viral instillation. (C) Representative image of GFP expression in KPL lung tumors. Cells were isolated from tumors to create KPL tumor cell lines. (D) Single cell clones from KPL tumors were grown to create KPL tumor cell lines (ex. KPL-C1, clone 1). Whole cell lysates were analyzed by western blotting using the indicated antibodies. (E) KPL-C2 cells were treated with increasing doses of ALW. Cell lysates were analyzed by western blotting using the indicated antibodies. (F) Colony assay of KPL-C2 cells with increasing doses of ALW. Quantification in the bottom panel. Data are presented as mean ± SEM. **, p<0.01; ***, p<0.001, Student’s t-test. (G) Western blot showing loss of PLCγ1 upon targeting of KPL-C2 cells with CRISPR-Cas9 sgPLCG1. (H) Colony assay of KPL-C2 cells targeted with sgPLCG1. Quantification in bottom panels. Representative data are presented as mean ± SD. *, p<0.05; **, p<0.01, Student’s t-test. (I-M) sgPLCG1 KPL-C2 cells were injected via tail vein injection back into Rosa26-LSL-Cas9-GFP mice. (I) Tumor formation was visible by GFP expression. (J) Quantification of GFP density of sgLacZ or sgPLCG1 KPL-C2 tumors. Data are presented as mean ± SEM. **, p<0.01; ***, p<0.001, Student’s t-test. (K) Proliferation of sgLacZ or sgPLCG1 KPL-C2 tumors was measured by PCNA immunohistochemistry staining. (L) Quantification of PCNA staining. Data are presented as mean ± SEM. *, p<0.05, Student’s t-test. (M) Apoptosis was measured by TUNEL immunohistochemistry staining. Quantified data are presented as mean ± SEM, Student’s t-test.

References

    1. Mayekar MK, Bivona TG. Current Landscape of Targeted Therapy in Lung Cancer. Clin Pharmacol Ther [Internet]. 2017. November 1 [cited 2019 Dec 16];102(5):757–64. Available from: http://doi.wiley.com/10.1002/cpt.810 - DOI - PubMed
    1. Rikova K, Guo A, Zeng Q, Possemato A, Yu J, Haack H, et al. Global Survey of Phosphotyrosine Signaling Identifies Oncogenic Kinases in Lung Cancer. Cell [Internet]. 2007. December 14 [cited 2019 Dec 16];131(6):1190–203. Available from: https://www.sciencedirect.com/science/article/pii/S009286740701522X - PubMed
    1. Pasquale EB. Eph receptors and ephrins in cancer: bidirectional signalling and beyond. Nat Rev Cancer [Internet]. 2010. March [cited 2019 Nov 11];10(3):165–80. Available from: http://www.nature.com/articles/nrc2806 - PMC - PubMed
    1. Amato KR, Wang S, Hastings AK, Youngblood VM, Santapuram PR, Chen H, et al. Genetic and pharmacologic inhibition of EPHA2 promotes apoptosis in NSCLC. J Clin Invest [Internet]. 2014. May 1 [cited 2016 Jul 5];124(5):2037–49. Available from: http://www.jci.org/articles/view/72522 - PMC - PubMed
    1. Amato KR, Wang S, Tan L, Hastings AK, Song W, Lovly CM, et al. EPHA2 Blockade Overcomes Acquired Resistance to EGFR Kinase Inhibitors in Lung Cancer. Cancer Res [Internet]. 2016. January 15 [cited 2016 Jul 5];76(2):305–18. Available from: http://www.ncbi.nlm.nih.gov/pubmed/26744526 - PMC - PubMed

Publication types