. 2022 Aug 10;13(1):4684.
doi: 10.1038/s41467-022-32348-3.

EGFR-mediated activation of adipose tissue macrophages promotes obesity and insulin resistance

Affiliations

EGFR-mediated activation of adipose tissue macrophages promotes obesity and insulin resistance

Shirong Cao et al. Nat Commun. .

Abstract

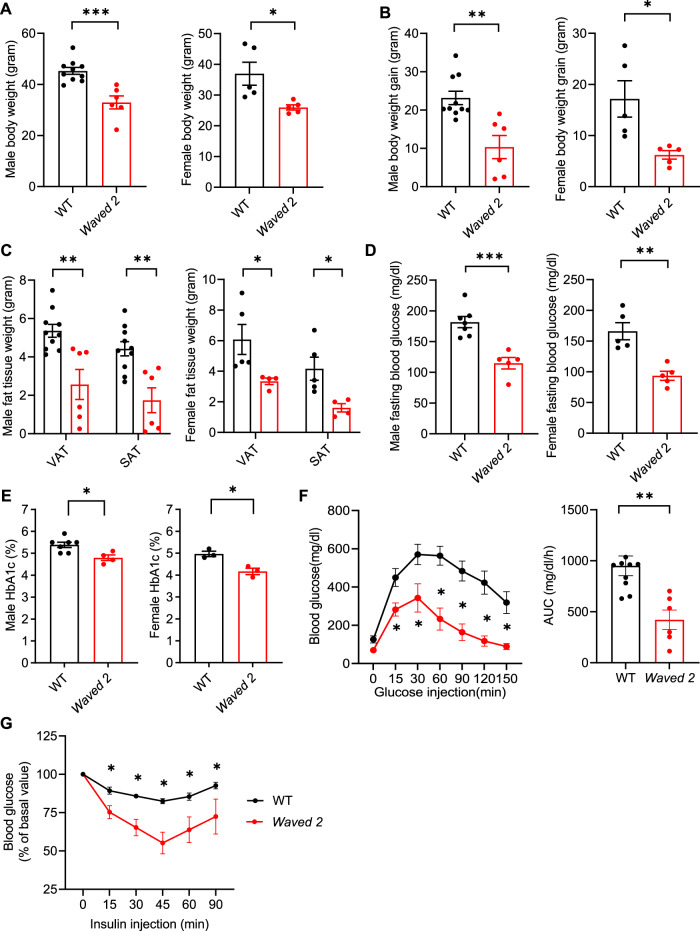
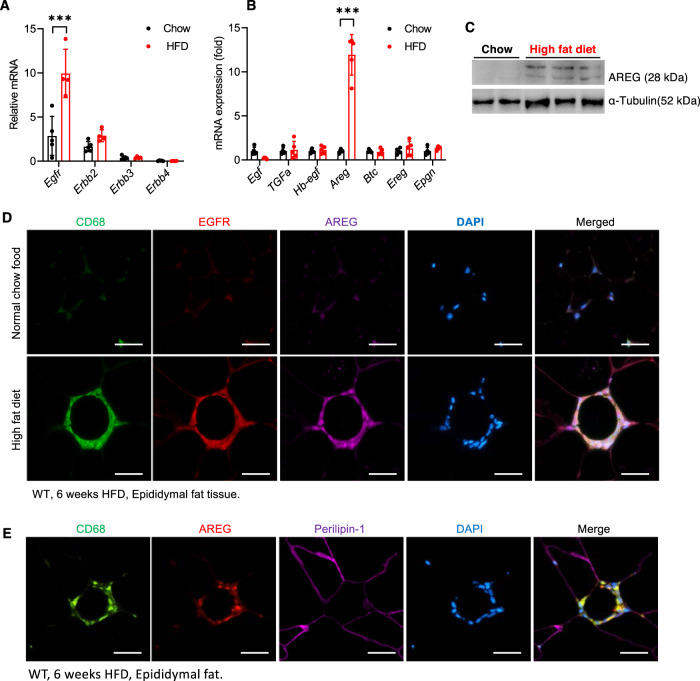
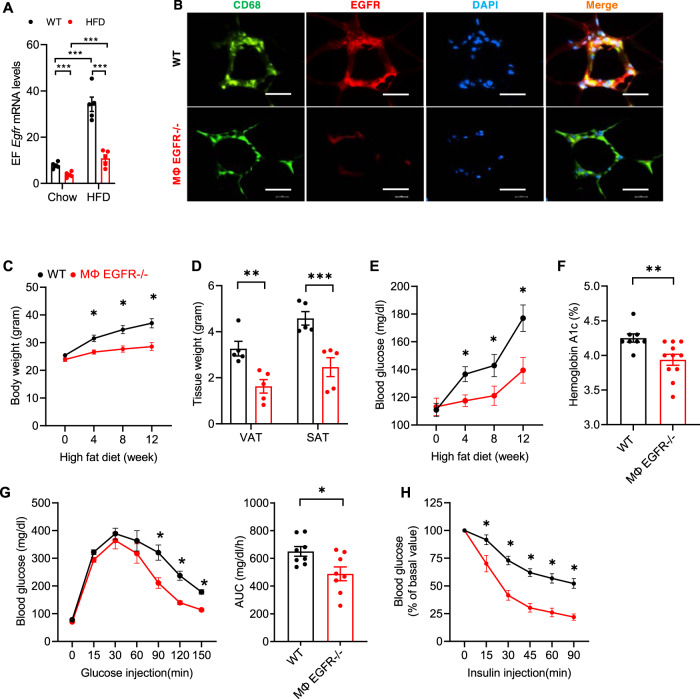
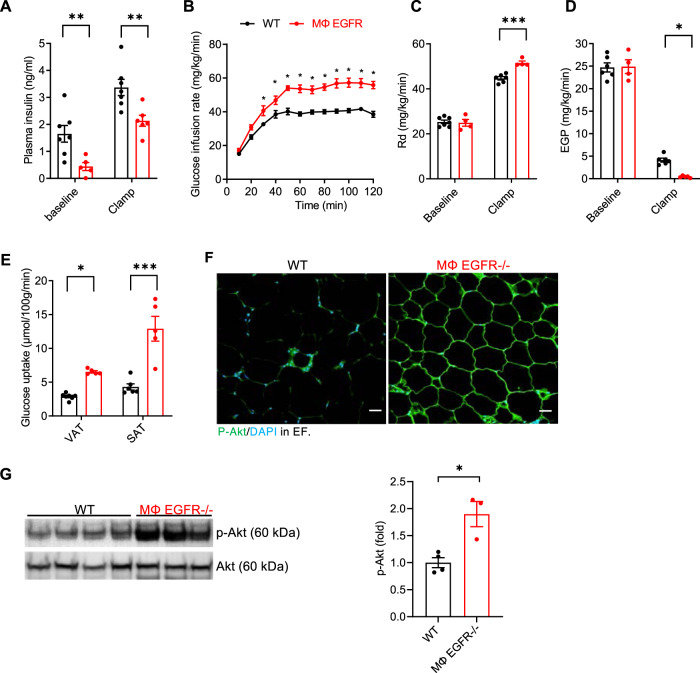
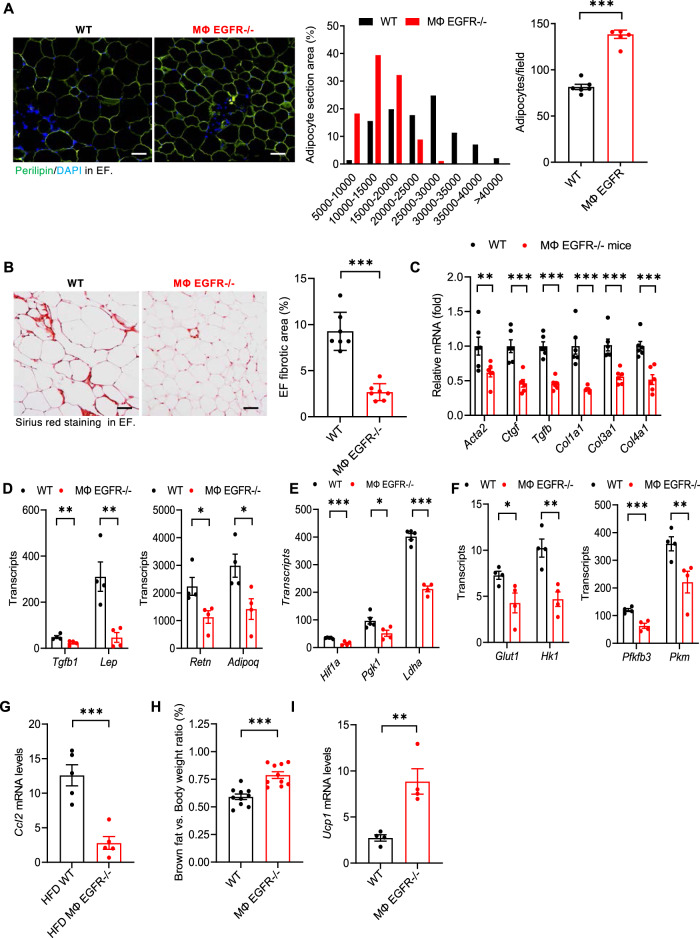
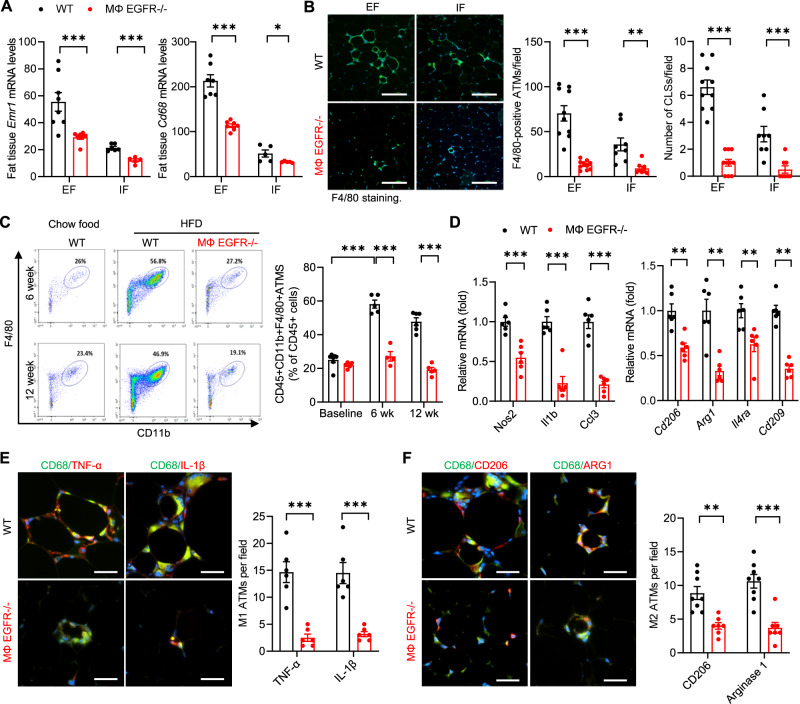
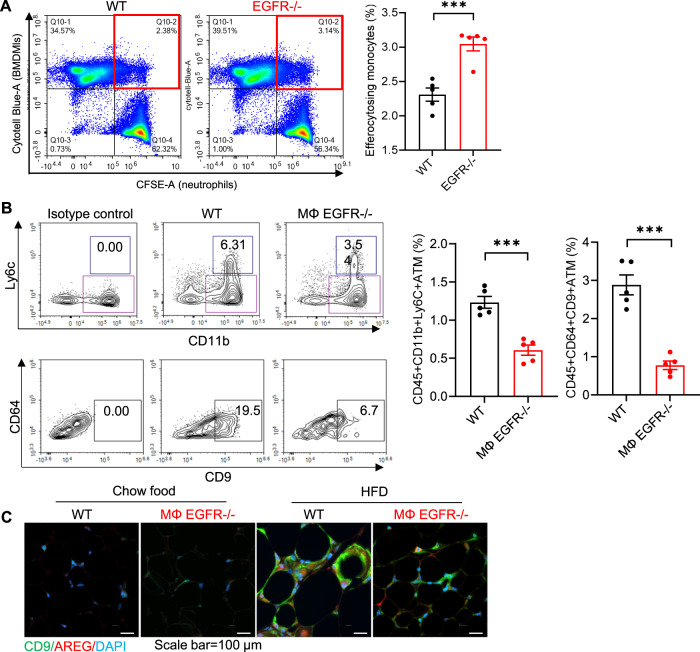
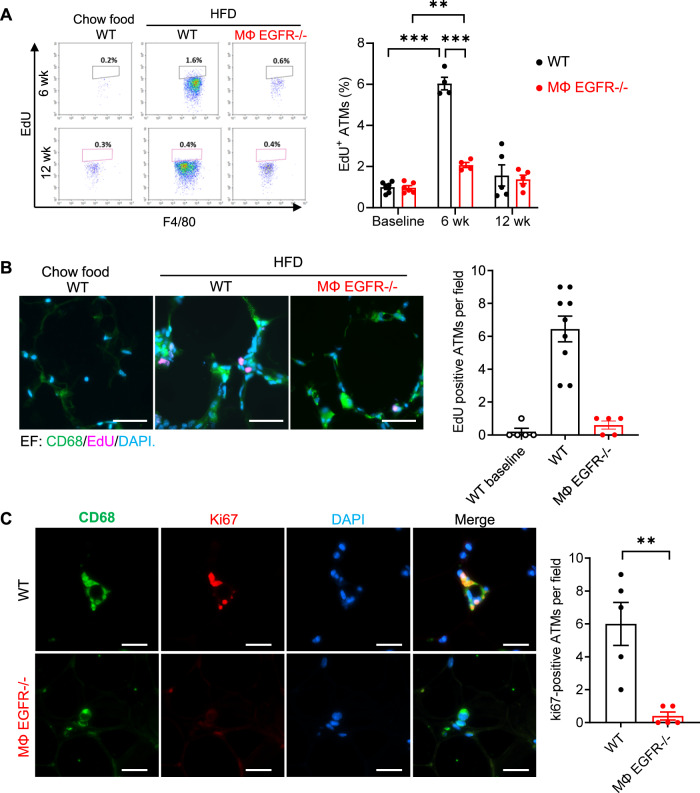
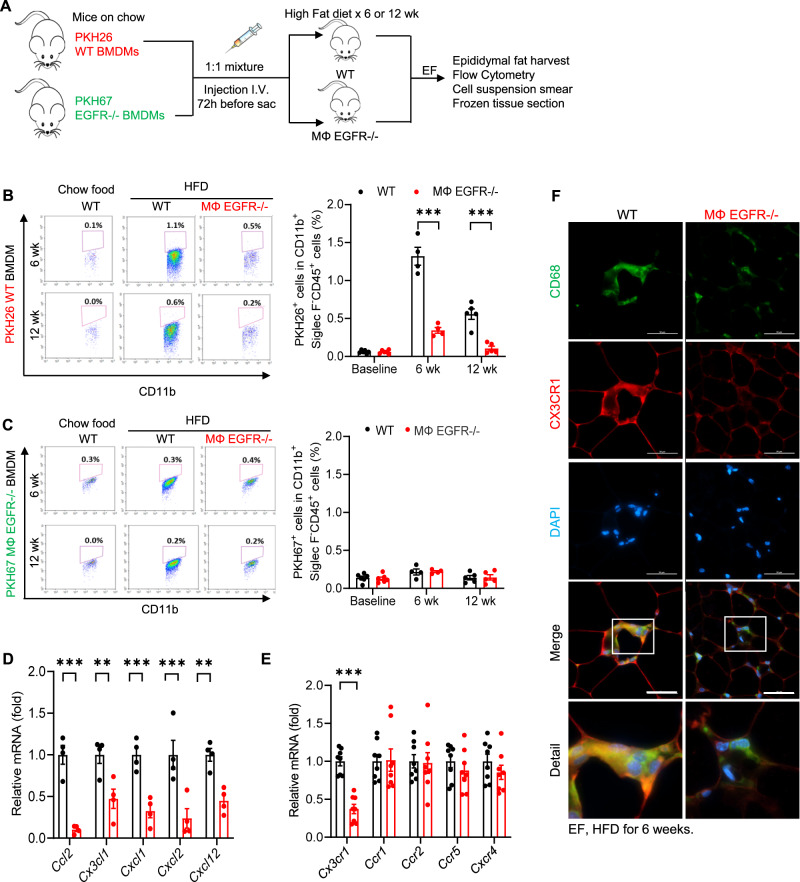
Obesity and obesity-related health complications are increasing in prevalence. Adipose tissue from obese subjects has low-grade, chronic inflammation, leading to insulin resistance. Adipose tissue macrophages (ATMs) are a source of proinflammatory cytokines that further aggravate adipocyte dysfunction. In response to a high fat diet (HFD), ATM numbers initially increase by proliferation of resident macrophages, but subsequent increases also result from infiltration in response to chemotactic signals from inflamed adipose tissue. To elucidate the underlying mechanisms regulating the increases in ATMs and their proinflammatory phenotype, we investigated the role of activation of ATM epidermal growth factor receptor (EGFR). A high fat diet increased expression of EGFR and its ligand amphiregulin in ATMs. Selective deletion of EGFR in ATMs inhibited both resident ATM proliferation and monocyte infiltration into adipose tissue and decreased obesity and development of insulin resistance. Therefore, ATM EGFR activation plays an important role in adipose tissue dysfunction.


Conflict of interest statement

The authors declare no competing interests.

Figures

Fig. 1
Fig. 1. Waved 2 mice developed less metabolic derangement in diet induced obesity.
Waved 2 mice with intrinsic EGFR tyrosine kinase deficiency and WT mice were fed the HFD for 12 weeks. A, B Both male and female Waved 2 mice had lower body weight (Male: n = 6 and 10; female: n = 5) A and body weight gain (Male: n = 6 and 10; female: n = 5) B. C Both male and female Waved 2 mice had less visceral adipose tissue (VAT) and subcutaneous adipose tissue (SAT) mass compared to WT mice (Male: n = 6 and 10; female: n = 4 and 5). D, E Both male and female Waved 2 mice had lower fasting blood glucose (Male: n = 5 and 7; female: n = 5) D and HbA1c (Male: n = 5 and 7; female: n = 3) E. N = 5 and 7. F, G Male Waved 2 mice had improved glucose tolerance (n = 6 and 9) F and insulin tolerance (n = 4) G. Data are means ± SEM, *P < 0.05, **P < 0.01, ***P < 0.001, analyzed using 2 tailed Student’s t test for A, B, D, and E; 2-way ANOVA followed by Bonferroni’s post hoc test for C; 2 tailed Student’s t test and 2-way ANOVA followed by Tukey’s post hoc test for F; and 2-way ANOVA followed by Tukey’s post hoc test for G.
Fig. 2
Fig. 2. Both EGFR and amphiregulin expression were selectively increased in ATMs in WT mice 6 weeks after the HFD.
A HFD treatment led to selective increases in Egfr mRNA levels in epididymal fat tissue. N = 4 and 5. B HFD treatment also led to selective increases in EGFR ligand, Areg mRNA levels in epididymal fat tissue. N = 4 and 5. C Immunoblotting confirmed increased EF AREG in HFD-treated mice. D Representative photomicrographs of 3 independent experiments showed that both EGFR and AREG expression was minimal in mice with chow food but was evident and primarily colocalized with CD68 in ATMs. Scale bar = 100 μm. E In HFD-treated mice, AREG expression in EF adipocytes was minimal (representative of 3 independent experiments). Scale bar = 100 μm. Data are means ± SEM, ***P < 0.001, analyzed using 2-way ANOVA followed by Bonferroni’s post hoc test for A and B.
Fig. 3
Fig. 3. Myeloid EGFR deficiency attenuated insulin resistance in diet-induced obesity.
WT (EGFRf/f) mice and MΦ EGFR−/− (CD11b-Cre; EGFRf/f) mice were fed the HFD for 12 weeks. A Epididymal fat (EF) Egfr mRFNA levels were markedly increased in WT mice response to the HFD. MΦ EGFR−/− mice had markedly lower EF Egfr mRNA levels compared to WT mice with chow food or with the HFD. N = 5. B Representative images showed that EGFR immunofluorescence was minimal in MΦ EGFR−/− mice but clearly evident in ATMs in WT mice. Scale bar = 100 μm. CF MΦ EGFR−/− mice had reduced increases in body weight (n = 10 and 11) C, visceral and subcutaneous fat tissue (VAT and SAT) (n = 5) D fasting blood glucose (n = 9 and 11) E and HbA1c (n = 8 and 11) F. G, H MΦ EGFR−/− mice exhibited improved glucose tolerance (n = 8 and 10) G and insulin tolerance (n = 9) H. Data are means ± SEM, *P < 0.05, **P < 0.01, ***P < 0.001, analyzed using 2 tailed Student’s t test for F; 2-way ANOVA followed by Tukey’s post hoc test for C, E, and H; 2-way ANOVA followed by Bonferroni’s post hoc test for A and D; and 2 tailed Student’s t test and 2-way ANOVA followed by Tukey’s post hoc test for G.
Fig. 4
Fig. 4. Mice with selective EGFR deletion in myeloid cells selectively attenuated white adipose tissue insulin resistance in diet-induced obesity.
Hyperinsulinemic-euglycemic clamps were performed on 5 h fasted WT and MΦ EGFR−/− mice after 12 weeks on the HFD. A MΦ EGFR−/− mice had lower plasma insulin levels at baseline and during clamp periods. N = 5 and 7. B MΦ EGFR−/− mice had less severe insulin resistance, as more glucose infusion was needed to maintain a constant blood glucose. N = 5 and 7. C, D. MΦ EGFR−/− mice had increased rates of glucose disappearance (Rd) (N = 4 and 7) C and decreased endogenous glucose production (EGP) (N = 4 and 7) D. E MΦ EGFR−/− mice had increased glucose uptake, a marker of insulin resistance in VAT and SA. N = 5 and 7. F Representative images showed more insulin-stimulated p-Akt in EF in MΦ EGFR−/− mice. Scale bar = 100 μm. G Immunoblotting determined higher insulin-stimulated p-Akt in EF in MΦ EGFR−/− mice. N = 3 and 4). Data are means ± SEM, *P < 0.05, **P < 0.01, ***P < 0.001, analyzed using 2-way ANOVA followed by Bonferroni’s post hoc test for A, and CE; 2-way ANOVA followed by Tukey’s post hoc test for B; and 2 tailed Student’s t test for G.
Fig. 5
Fig. 5. Myeloid EGFR−/− mice had reduced adipocyte hypertrophy and adipose tissue adipokines, glycolysis, hypoxia, and fibrosis in response to the HFD.
WT and MΦ EGFR−/− mice were fed the HFD for 12 weeks. A Image analysis of perilipin immunofluorescence showed smaller but increased adipocytes in EF in MΦ EGFR−/− mice than WT mice. N = 10, scale bar = 100 μm. B Quantitative Sirius Red staining indicated less fibrosis in EF in MΦ EGFR−/− mice than WT mice. N = 6, scale bar = 100 μm. CG MΦ EGFR−/− mouse EF had lower profibrotic and fibrotic genes including Acta2, Ctgf, Tgfb1, Col1a1, Col3a1, and Col4a1, n = 6 C, lower adipokine genes including Lep, Adipoq, Retn, and Tgfb1, n = 4 D, lower hypoxia-related genes including Hif1a, Pgk1, and Ldha, n = 4 E, lower glycolytic genes including Glut1, Hk1, Pfkfb3, and Pkm, n = 4 F, and lower chemoattractant Ccl2 gene, n = 5 G. H, I MΦ EGFR−/− mice had higher interscapular brown fat, n = 10 H and higher inguinal fat Ucp1 transcripts, a beige marker, n = 4 I. Data are means ± SEM, **P < 0.01, ***P < 0.001, analyzed using 2 tailed Student’s t test for A, B, GI, and 2-way ANOVA followed by Bonferroni’s post hoc test for CF.
Fig. 6
Fig. 6. Myeloid EGFR−/− mice had less ATM accumulation and lower proinflammatory cytokines/chemokine in diet-induced obesity.
WT and MΦ EGFR−/− mice were fed the HFD for 6 and 12 weeks. A MΦ EGFR−/− mice had lower Emr1 (F4/80) (N = 5 and 8) and Cd68 (N = 5 and 8) expression in both EF and IF compared to WT mice at 12 weeks after the HFD. B Quantitative F4/80 staining demonstrated fewer ATMs and CLSs in both EF and IF in MΦ EGFR−/− mice than WT mice at 12 weeks after the HFD. N = 8 and 10, scale bar = 200 μm. C Flow cytometry confirmed less EF CD45+CD11b+F4/80+ ATMs at both 6 and 12 weeks after the HFD in MΦ EGFR−/− mice than WT mice. N = 4–6. D MΦ EGFR−/− mice had lower EF mRNA expression of both proinflammatory cytokines (Nos2, Il1b, and Ccl3) and antiinflammatory cytokines (Cd206/Mrc1, Arg1, Il4ra, and Cd209) at 12 weeks on the HFD. N = 6. E, F Double immunofluorescent staining demonstrated fewer M1 ATMs (CD68+TNF+ and CD68+IL-1β+ positive cells) (N = 6) and M2 ATMs (CD68+CD206+ and CD68+Arg1+ positive cells) (N = 8) in EF in MΦ EGFR−/− mice than WT mice. Scale bar = 100 μm. Data are means ± SEM, **P < 0.01, ***P < 0.001, analyzed using 2-way ANOVA followed by Bonferroni’s post hoc test for all.
Fig. 7
Fig. 7. Myeloid EGFR−/− mice had decreased subpopulations of ATMs in diet-induced obesity.
A An efferocytosis assay was performed by ex vivo co-culturing BMDMs (labeled with Cytotell Blue) isolated from WT and myeloid EGFR−/− mice with neutrophils isolated from WT mice that were treated with Staurosporine to induce apoptosis and labeled with CFSE. The first quadrant (in red) represents the efferocytosing monocyte population. Flow cytometry analysis showed that EGFR−/− BMDMs had enhanced efferocytosis of apoptotic neutrophils, as indicated by a higher ratio of phagocytic to non-phagocytic cells. N = 4 and 5. B Flow cytometric analysis of epididymal fat ATMs (gating on CD45 + , Ly6G-, CD3-, CD4-, CD8-, SiglecF-) determined that both CD11b + , Ly6C + (Ly6C + ) ATMs and CD11b + , Ly6C-, CD64 + , F4/80 + , CD9 + (Ly6C-CD9 + ) ATMs were lower in MΦ EGFR−/− mice than WT mice fed the HFD for 6 weeks. N = 5. C Double immunofluorescent staining determined that both CD9 and AREG expression was evident and colocalized in ATMs in CLSs in WT mice with HFD while their expression was lower in MΦ EGFR−/− mice on HFD and minimal in both WT and MΦ EGFR−/− mice on chow food. Scale bar = 100 μm. Data are means ± SEM, ***P < 0.001, analyzed using 2 tailed Student’s t test.
Fig. 8
Fig. 8. Mice with myeloid EGFR deletion had decreased ATM proliferation in diet-induced obesity.
WT and MΦ EGFR−/− mice were fed the HFD for 6 or 12 weeks. A The significantly increased proliferating rate of ATMs in EF (EdU positive cells) seen in WT mice at 6 weeks was markedly attenuated in MΦ EGFR−/− mice. N = 4 and 5 and 6. B, C A decreased rate of proliferation in MΦ EGFR−/− mice at 6 weeks was also indicated by decreased EdU and CD68-double positive cells (n = 5 and 9) B and Ki67 and CD68-double positive cells (n = 5) C. Scale bar = 100 μm. Data are means ± SEM, **P < 0.01, ***P < 0.001, analyzed using 2-way ANOVA followed by Bonferroni’s post hoc test for A and B, and 2 tailed Student’s t test for C.
Fig. 9
Fig. 9. Both intrinsic EGFR in bone marrow derived monocyte (BMDMs) and adipose tissue from MΦ EGFR−/− mice affected the recruitment of BMDMs in diet-induced obesity.
WT and MΦ EGFR−/− mice were fed the HFD for 6 or 12 weeks and EF was used for experiment. A Schematic of experimental protocol. B WT BMDMs had greater EF infiltration at 6 weeks than at 12 weeks in WT recipient mice. Infiltration into EF was markedly decreased in MΦ EGFR−/− recipients at both time points. N = 4 and 5 and 6. C The infiltration of EGFR−/− BMDMs in EF was not increased after high fat diet in either WT or MΦ EGFR−/− recipients. N = 4 and 5 and 6. D MΦ EGFR−/− mouse epididymal fat tissue had lower mRNA expression of chemoattractants, including Ccl2, Cx3cl1, Cxcl1, Cxcl2, and Cxcl12. N = 4. E ATMs isolated from MΦ EGFR−/− mice had lower Cx3cr1 mRNA expression. N = 8. F High CX3CR1 expression in ATMs seen in WT mice was decreased in MΦ EGFR−/− mice 6 weeks after the HFD. Scale bar = 50 μm. Data are means ± SEM, *P < 0.05, **P < 0.01, ***P < 0.001, analyzed using 2-way ANOVA followed by Bonferroni’s post hoc test for all.

References

    1. Zheng C, et al. Local proliferation initiates macrophage accumulation in adipose tissue during obesity. Cell Death Dis. 2016;7:e2167. doi: 10.1038/cddis.2016.54. - DOI - PMC - PubMed
    1. Haase J, et al. Local proliferation of macrophages in adipose tissue during obesity-induced inflammation. Diabetologia. 2014;57:562–571. doi: 10.1007/s00125-013-3139-y. - DOI - PubMed
    1. Muir LA, et al. Frontline science: rapid adipose tissue expansion triggers unique proliferation and lipid accumulation profiles in adipose tissue macrophages. J. Leukoc. Biol. 2018;103:615–628. doi: 10.1002/JLB.3HI1017-422R. - DOI - PMC - PubMed
    1. Amano SU, et al. Local proliferation of macrophages contributes to obesity-associated adipose tissue inflammation. Cell Metab. 2014;19:162–171. doi: 10.1016/j.cmet.2013.11.017. - DOI - PMC - PubMed
    1. Schlessinger J. Ligand-induced, receptor-mediated dimerization and activation of EGF receptor. Cell. 2002;110:669–672. doi: 10.1016/S0092-8674(02)00966-2. - DOI - PubMed

Publication types